


Wright Portfolio Review
A guide to reading your review
Everything the tool shows you, what each number is measured against, and how to read it. For investors using Portfolio Review at wrightresearch.in.
1What this tool does
Portfolio Review takes your actual holdings — stocks, mutual funds, or both — and measures them against Wright's published research framework. It answers questions your broker app doesn't: how concentrated the portfolio really is, whether your funds hold the same companies, what your fees cost over a decade, and how this exact mix behaved in past market falls.
There are two separate reviews, on two tabs of the same page:
- Equity — your stock holdings.
- Mutual Funds — your fund folios.
You can run one or both. They are scored separately, because stocks and funds fail in different ways.
2Before you start
You need one of the following:
- Your broker login (for stocks, via the Smallcase gateway), or
- Your PAN and access to your registered mobile or email (for mutual funds, via MF Central), or
- A holdings file you already have — a broker export, or a CAMS/KFintech statement, in CSV or Excel.
There is nothing to install, no account setup, and no KYC form to complete before running a review.
3Getting your holdings in
3.1 Stocks
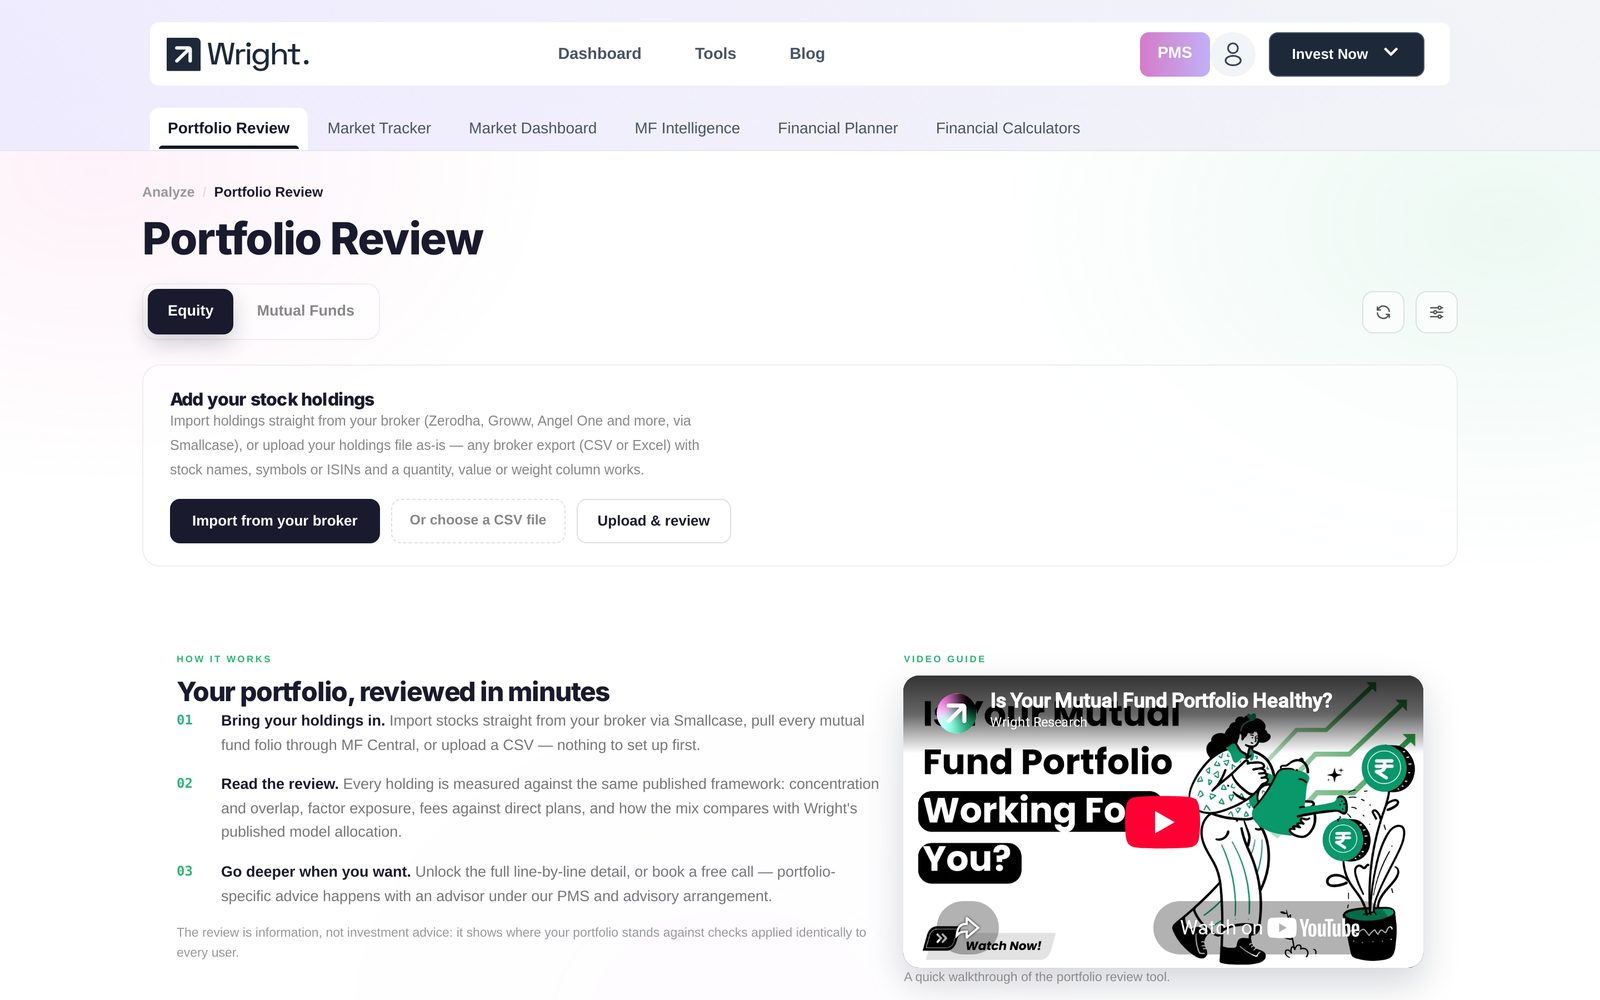
Open the Equity tab. The panel at the top gives you two routes.
Import from your broker. This opens the Smallcase gateway, where you pick your broker — Zerodha, Groww, Angel One and the other major brokers are supported — and log in inside that window. Your holdings arrive with quantities and buy prices.
Your broker credentials are entered in the broker's own gateway. They are never seen or stored by Wright.
Or choose a CSV file. Pick a file, then press Upload & review. Any broker export works as-is: the tool reads stock names, NSE symbols or ISINs, plus a quantity, value or weight column, whatever the column headers happen to say.
3.2 Mutual funds

Open the Mutual Funds tab. Two routes again.
Import from MF Central. MF Central is the industry registry operated by CAMS and KFintech. Authorising it returns every folio you hold across every AMC — including funds bought years ago through a platform you no longer use. This is the most complete route, and completeness matters: the overlap and fee analysis are only honest when every fund is counted.
Your review is generated a few minutes after the import finishes. The page refreshes itself when it is ready.
Add funds manually. Useful for a one-off holding, or if you'd rather not connect anything.
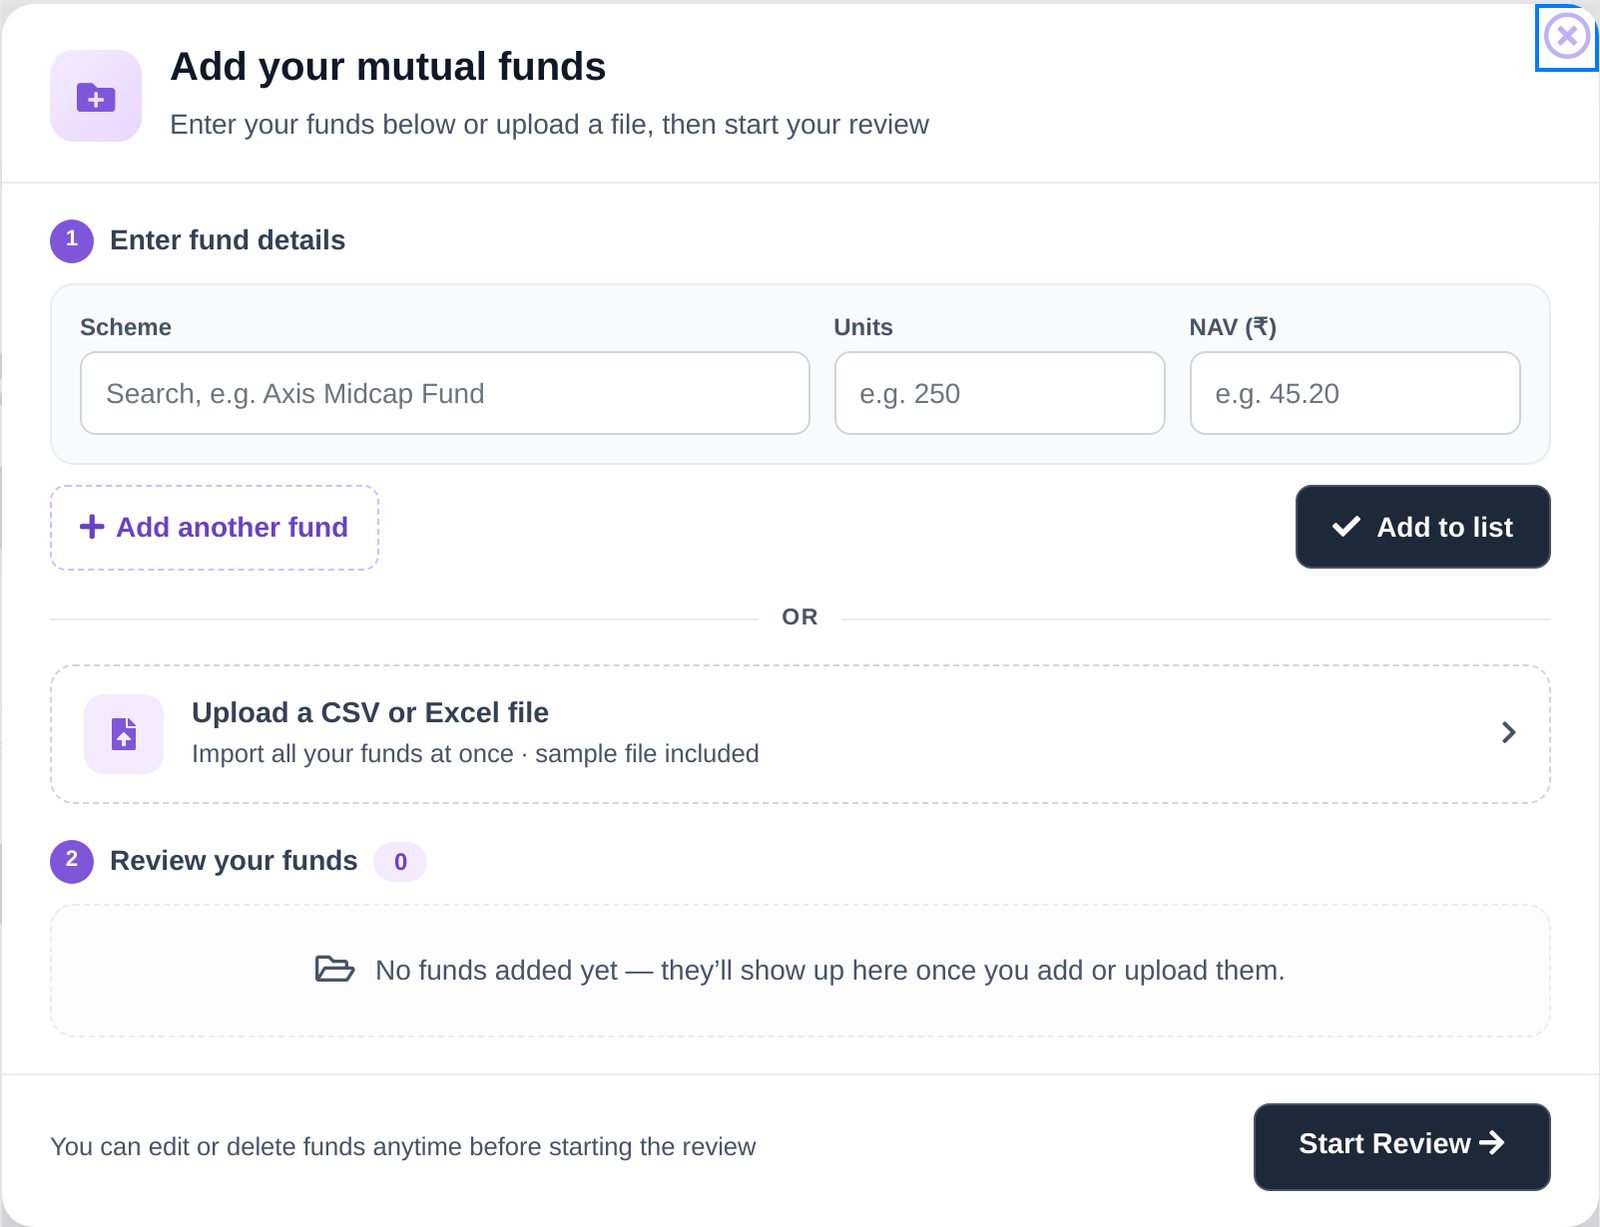
Search for the scheme, enter units and NAV, and Add to list. Repeat for as many funds as you like, then press Start Review. You can edit or remove anything on the list before you start.
Or upload a file. The same window has an Upload a CSV or Excel file option, with a sample file you can download.
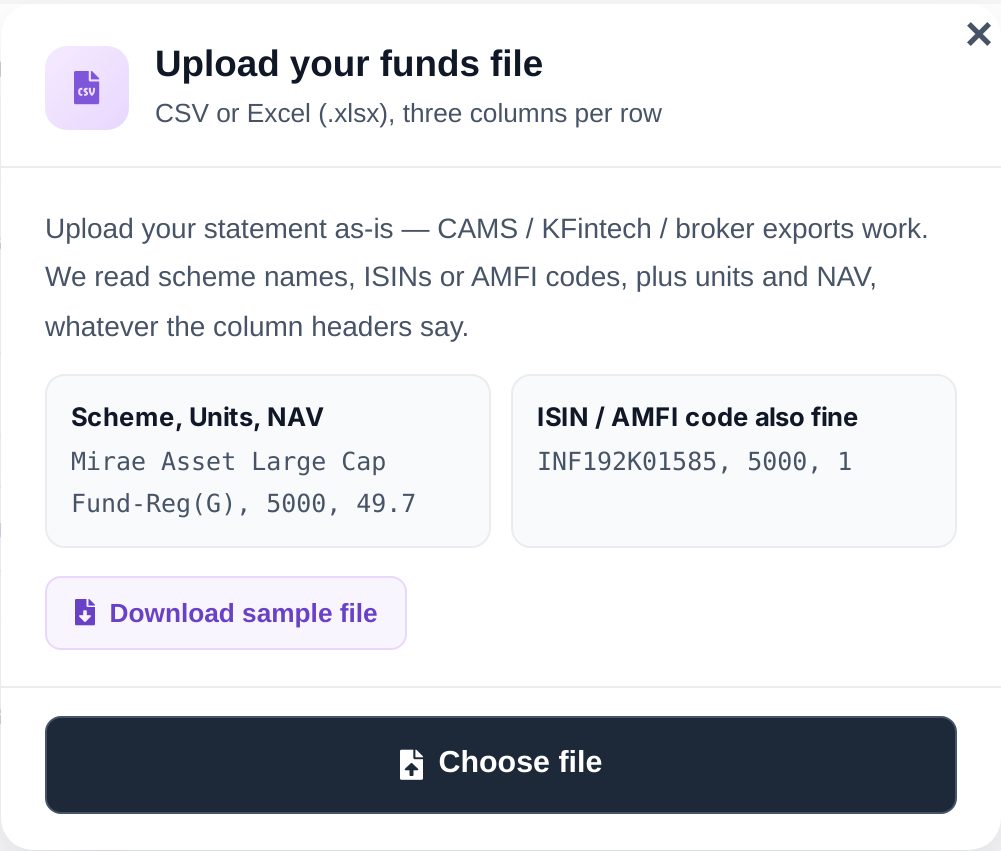
Three columns per row is all it needs: scheme, units and NAV. Scheme names, ISINs or AMFI codes all work, in whatever order your statement puts them.
3.3 Checking what matched
Nothing is saved until you have seen it. After a file is read, every row is shown back to you with its scheme, units and NAV, and a header that counts what matched.
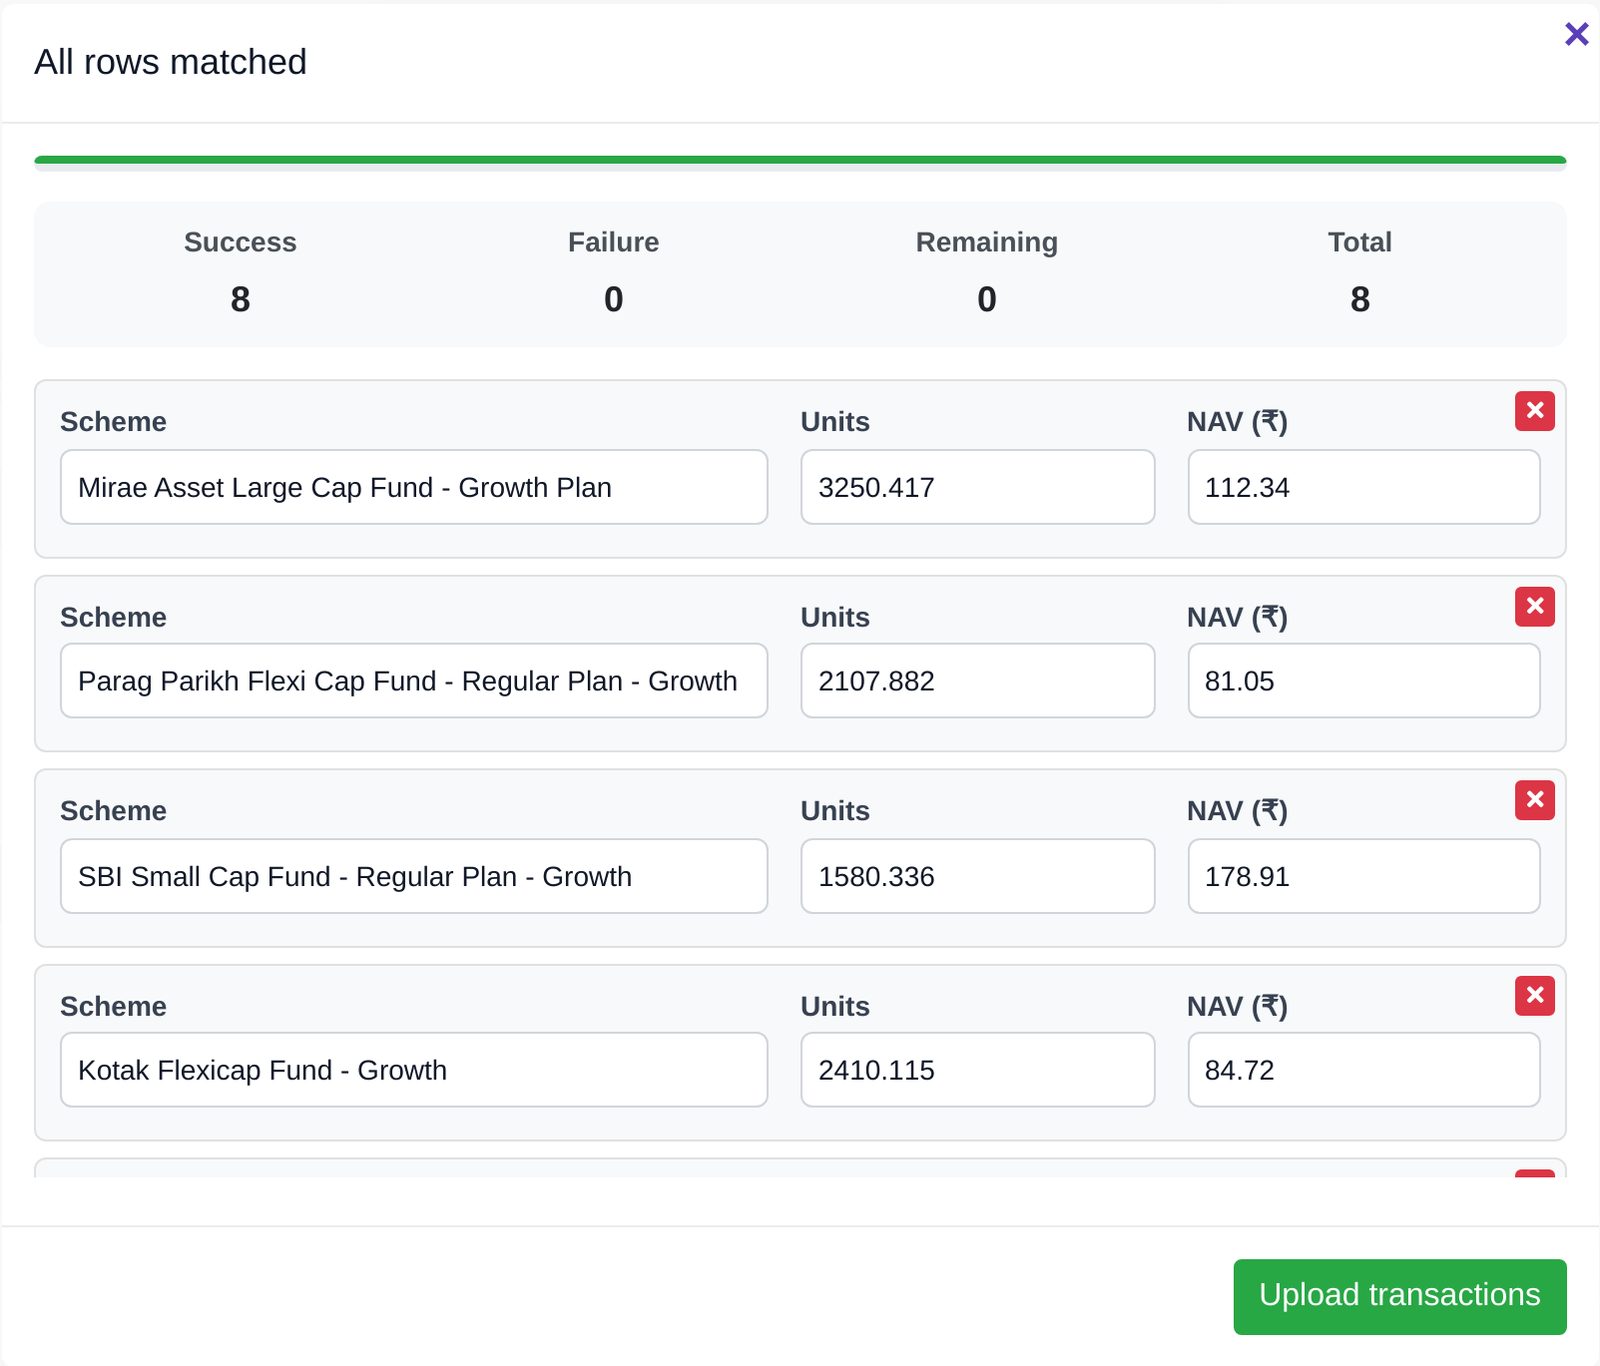
- Rows the tool matched with confidence appear with their details filled in. You can edit any field, or remove a row with the ✕ button.
- Rows it could not place are flagged and skipped rather than guessed at — the count at the top tells you how many (for example, "7 of 8"). The rest of the upload still goes through.
Press Upload transactions to save and start the review.
3.4 Refreshing later
The refresh button at the top right of the review re-imports your holdings and re-runs every check. Use it after you buy or sell, so the review always reflects what you hold now — not what you held when you first ran it.
4Reading your equity review
4.1 The hero card
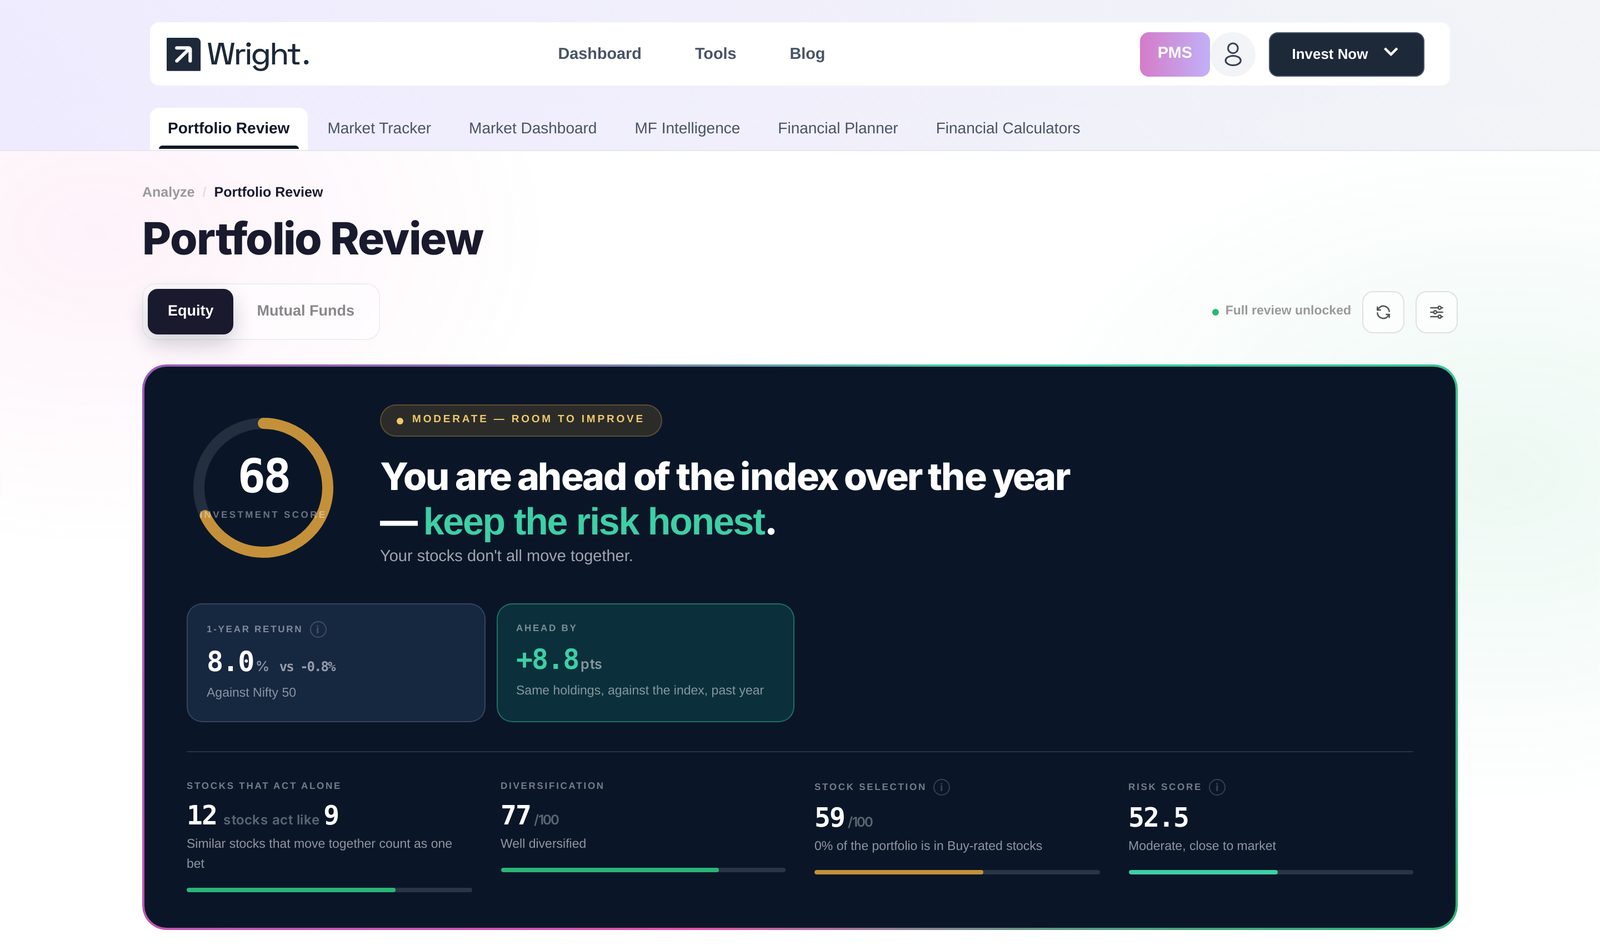
The card at the top summarises the whole book.
Investment score (0–100). A composite of the three sub-scores below it. The band beside it reads the number for you: Strong, Moderate — room to improve, or Needs attention.
The headline. One sentence stating the most important fact about your book. It is generated from your numbers — whether you are ahead of or behind the index, and whether your holdings move together — not chosen from a list of encouraging phrases.
1-year return vs Nifty 50. What today's holdings, at today's weights, returned over the last twelve months, against the index over the same period. Weights are held constant deliberately: this measures the portfolio, separately from when you happened to buy each position.
Then four measures across the bottom:
| Tile | What it means | How to read it |
|---|---|---|
| Stocks that act alone | The effective number of independent positions, after netting down holdings of similar size that move together | "12 stocks act like 9" means three of your positions are not adding diversification |
| Diversification | How evenly risk is spread across sectors, industries and individual names, against published caps | Higher is more evenly spread. 77/100 is well diversified |
| Stock selection | The share of the portfolio sitting in stocks that pass our research screens and carry positive ratings | A low score means most of the book sits outside what our research currently rates positively |
| Risk score | Where the portfolio's beta and volatility sit as a percentile of the whole market | ~50 moves like the market · 65+ aggressive · below 35 defensive |
4.2 Where you sit against the limits
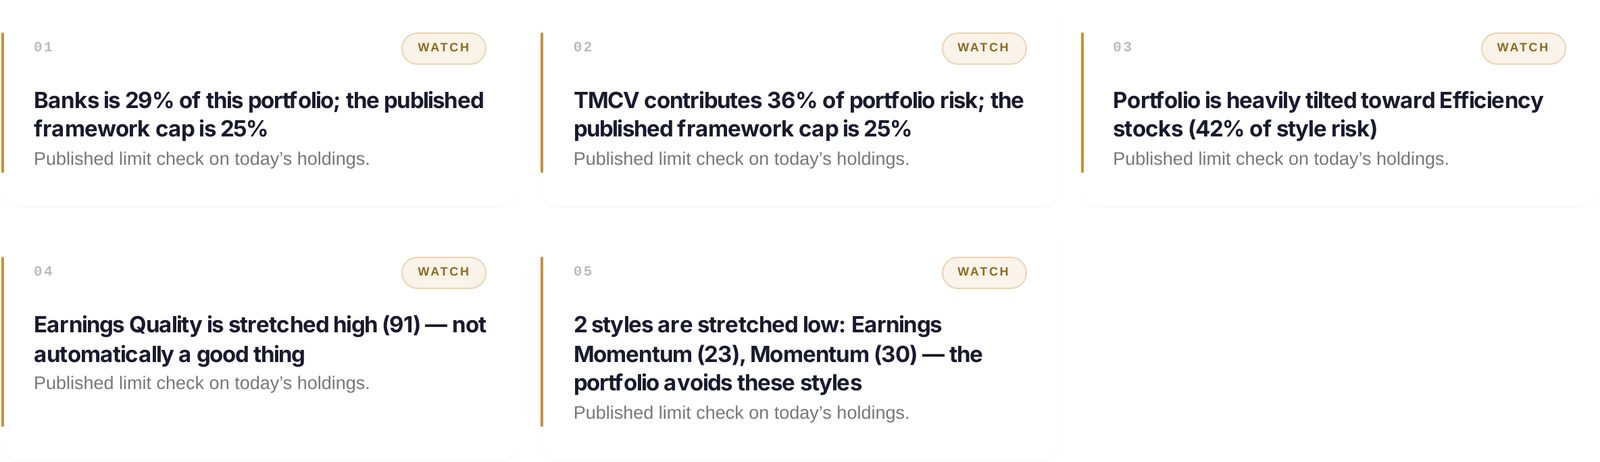
Every finding is a numbered card with a status:
- Breach — outside a published limit.
- Watch — inside the limit, but close to it, or flagged by another check.
Each card states the fact and the limit beside it, so there is nothing to interpret: "Banks is 29% of this portfolio; the published framework cap is 25%." The limits — maximum weight per sector, per industry, and per single stock's contribution to total portfolio risk — are published and identical for every user.
If nothing breaches, the section says so.
4.3 Which styles the portfolio leans on
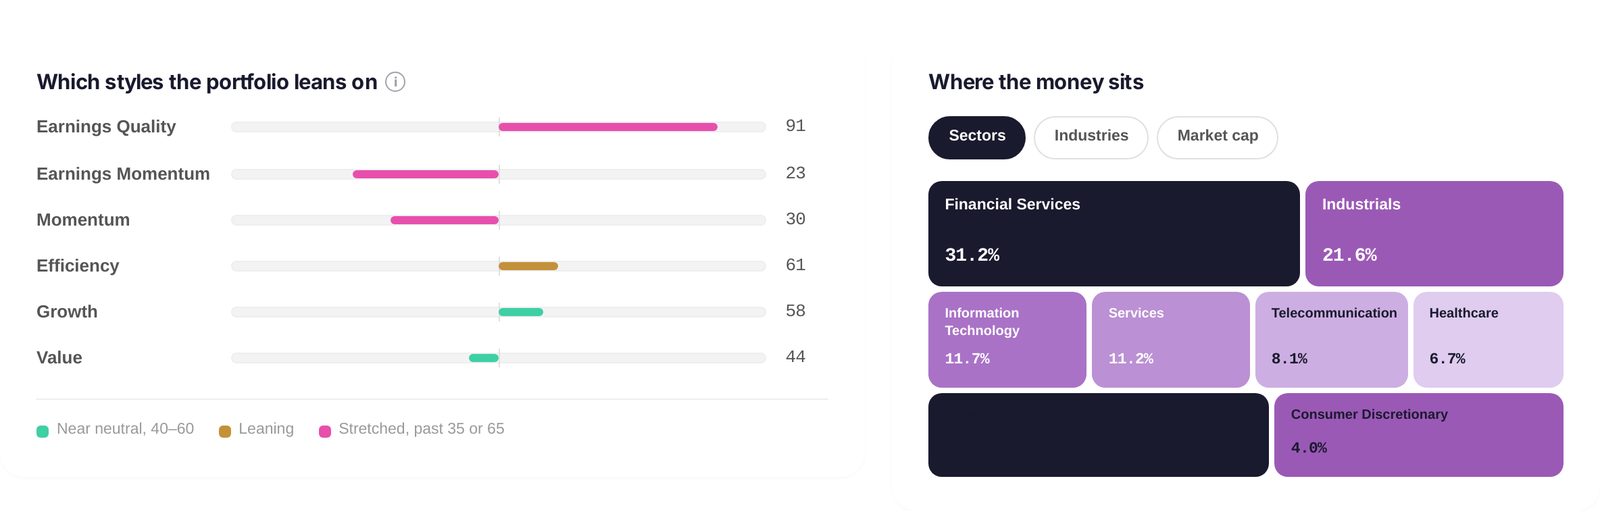
Six styles explain most of why an equity portfolio behaves the way it does. Every holding carries a 0–100 score on each, and the bars show the weighted average for your book:
Earnings Quality · Earnings Momentum · Momentum · Efficiency · Growth · Value
The colour legend tells you how far from neutral each one sits:
| Colour | Range | Meaning |
|---|---|---|
| Green | 40–60 | Near neutral — roughly in line with the market |
| Amber | Leaning | Tilted, but not extreme |
| Pink | Past 35 or 65 | Stretched, high or low |
A stretched score is not automatically good or bad — it tells you what the portfolio is betting on. A book stretched high on Momentum rides trends and is hit hardest when they reverse. A book stretched high on Earnings Quality tends to hold up better in falls and lag in sharp rallies.
Where the money sits, alongside, maps the same portfolio by sector, industry or market cap — switch with the tabs. The biggest boxes are where your money is.
4.4 Which holdings are really one decision
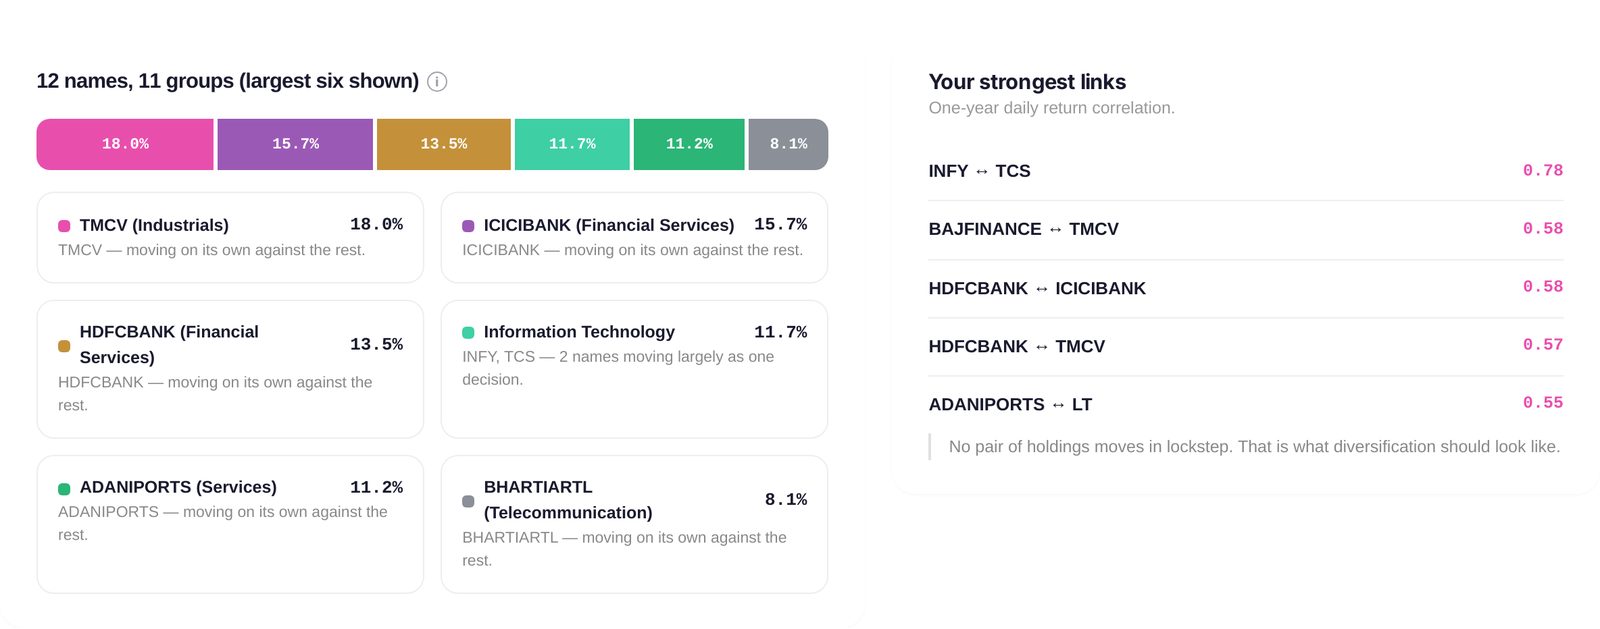
Two stocks that move together are, for practical purposes, one position. This section groups your holdings by how closely their daily returns track each other over the past year, and shows how many genuinely separate groups you own — "12 names, 11 groups".
Your strongest links lists the most closely-moving pairs with their correlation. As a rule of thumb: 0.70 and above means the two names are doing one job. Below that, they are separate bets. The note underneath reads the result for you.
4.5 Quality and risk
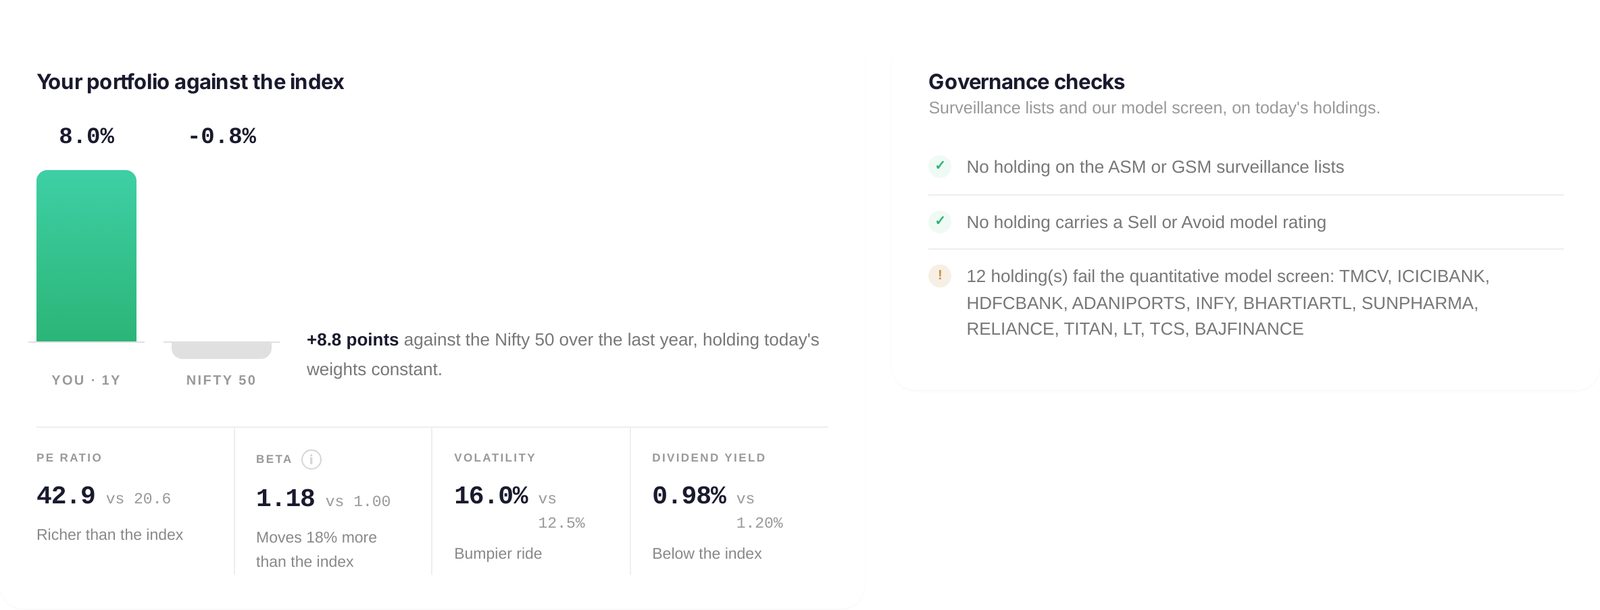
Four like-for-like comparisons against the Nifty 50, each with its reading in plain words:
| Measure | What it tells you |
|---|---|
| PE ratio | What you pay per rupee of earnings, against the index. Higher = richer |
| Beta | How much the portfolio moves for a given index move. 1.18 = moves 18% more |
| Volatility | The size of the typical swing. Higher = bumpier ride |
| Dividend yield | Weighted average income, against the index |
Governance checks run three tests on today's holdings and report by name if any fail:
- Is any holding on an exchange surveillance list (ASM or GSM)?
- Does any holding carry a Sell or Avoid model rating?
- Does any holding fail our quantitative model screen?
A holding failing the model screen is not a warning about the company — it means the stock does not currently pass the filters our own strategies use.
4.6 What it did in past falls
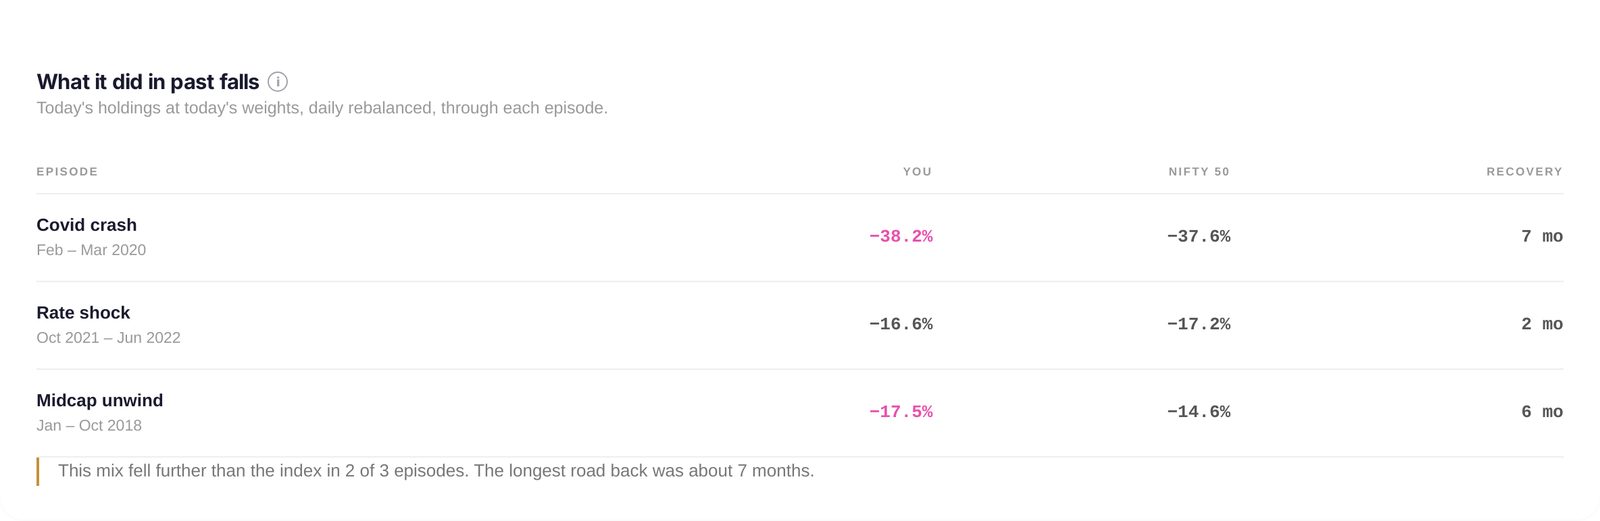
Rather than a hypothetical stress test, the tool replays today's holdings at today's weights through three real market episodes, using each stock's actual daily price history:
| Episode | Period |
|---|---|
| Covid crash | Feb – Mar 2020 |
| Rate shock | Oct 2021 – Jun 2022 |
| Midcap unwind | Jan – Oct 2018 |
For each you get the maximum fall, the Nifty 50's fall beside it, and how many months recovery took. Where a holding has no price history for an episode it is dropped and the rest re-weighted; if too little of the book has history, the row says so instead of filling the gap with a guess.
Read this as a description of the mix, not a forecast. It tells you how this combination of businesses has behaved when markets fell — which is the closest thing to evidence available.
4.7 Your holdings, line by line
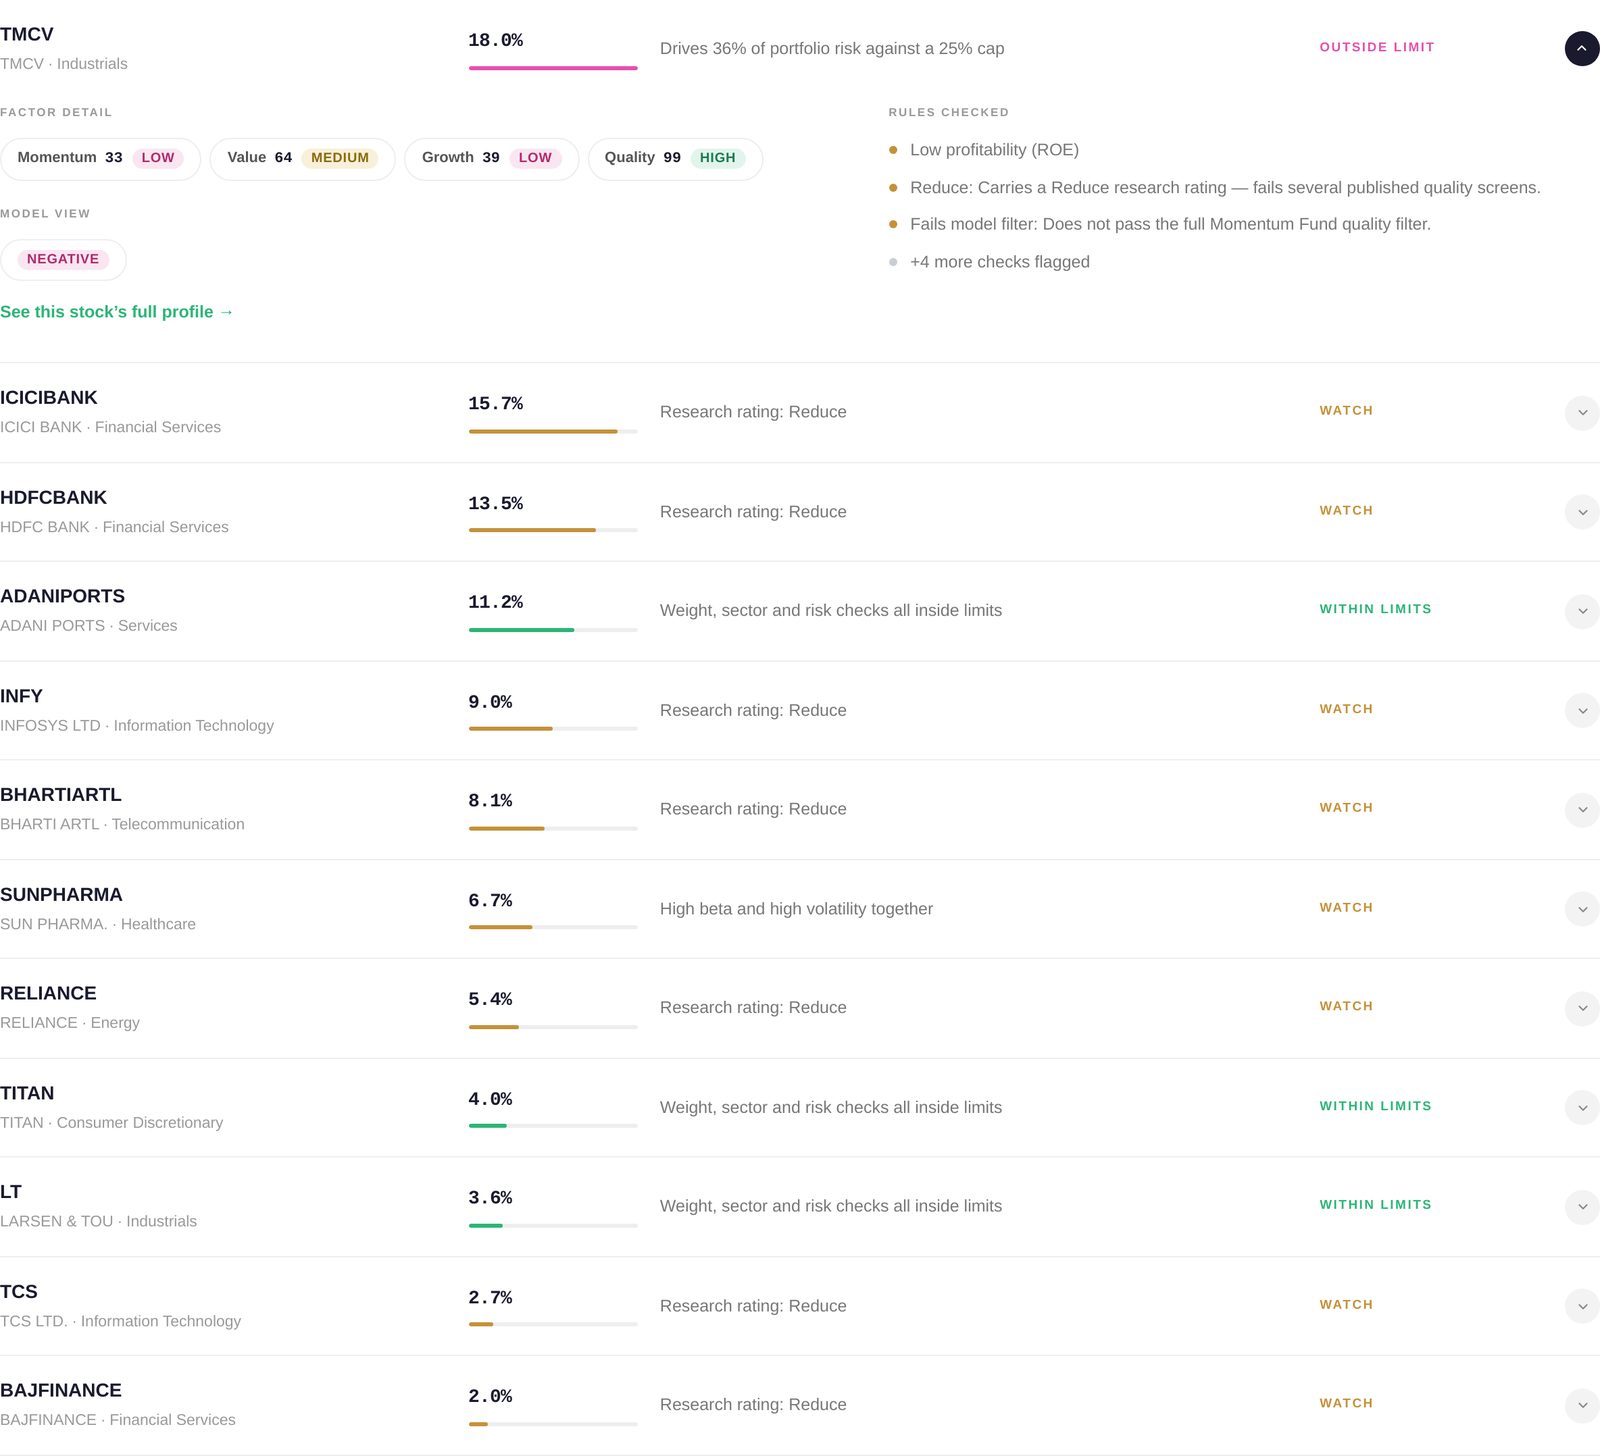
Every stock, ordered by weight, with the reason for its status beside it and a chip on the right:
- Outside limit — a Sell or Avoid rating, or more than 25% of the portfolio's risk from that single name.
- Watch — a breached sector, a Reduce rating, or high beta and high volatility together.
- Within limits — weight, sector and risk checks all pass.
Click the chevron on any row to open it.
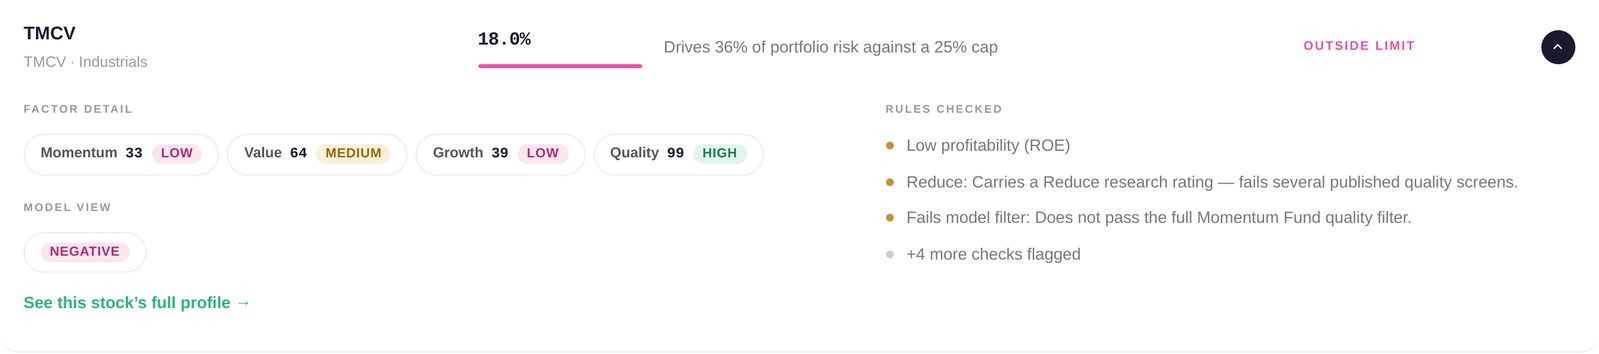
| Section | What it shows |
|---|---|
| Factor detail | Momentum, Value, Growth and Quality scores, each banded High (65+), Medium (40–64) or Low (below 40) |
| Model view | One word — Extremely positive, Positive, Neutral, Negative, Extremely negative |
| Rules checked | The most severe checks that fired for this stock, and a count of the rest |
| Full profile | A link to the stock's complete research page |
5Reading your mutual fund review
5.1 The hero card
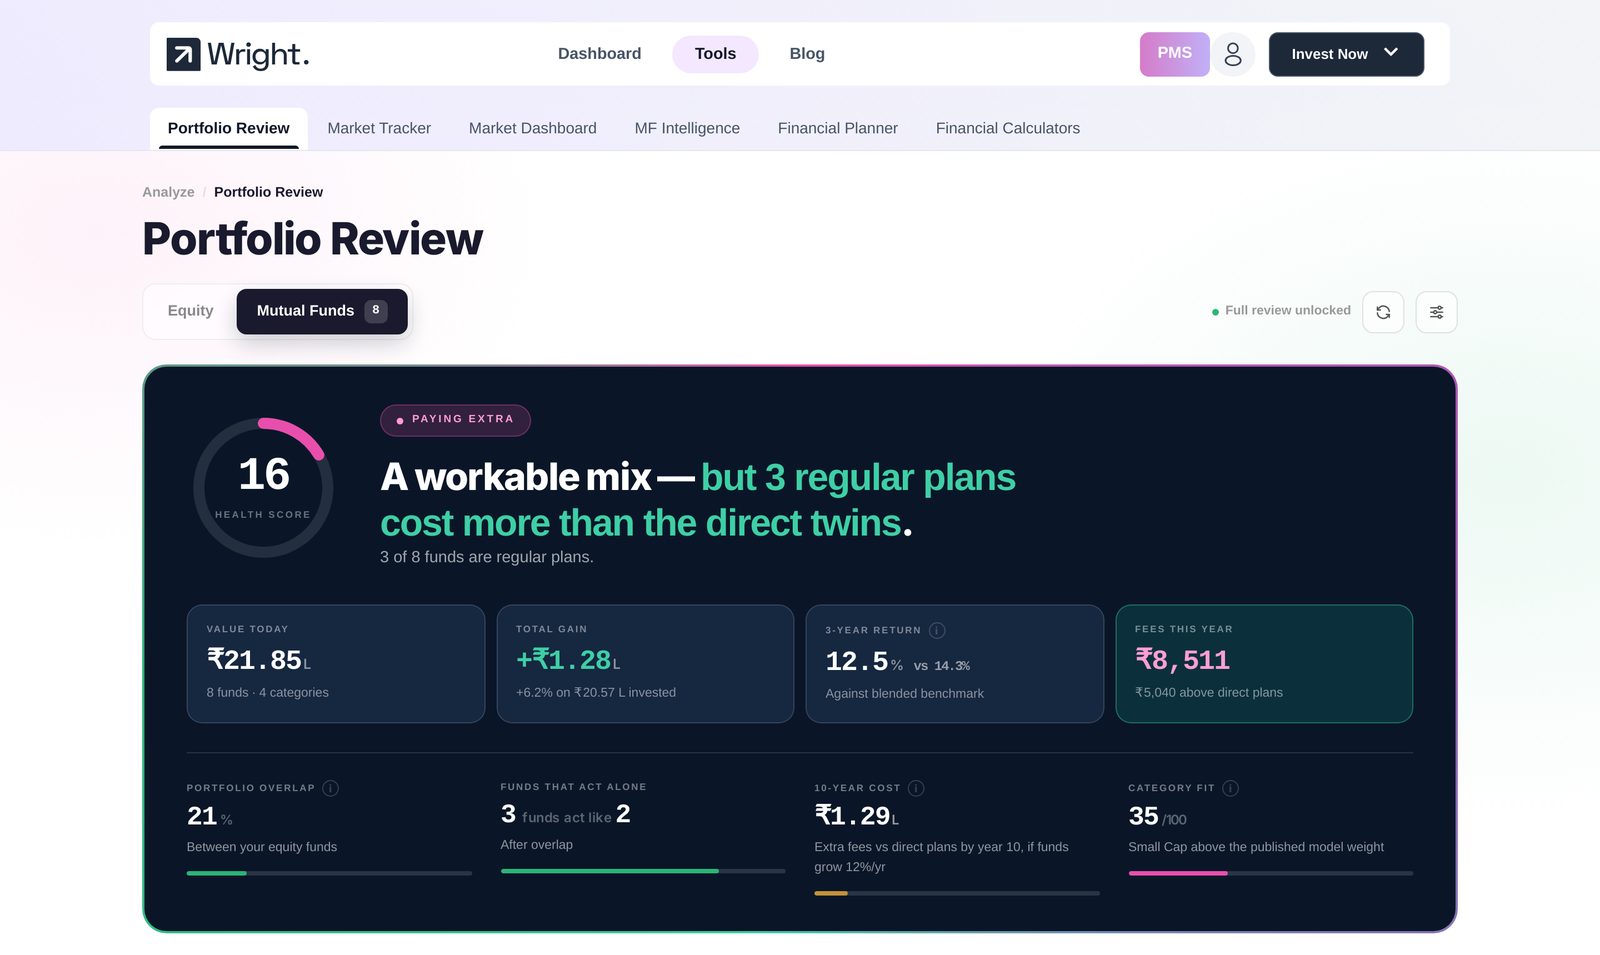
Health score (0–100). A composite of overlap, cost, category fit and track record, with a band that reads it — for example, Paying extra.
The first row of tiles covers what you hold:
| Tile | What it means |
|---|---|
| Value today | Current value at live NAVs, with the number of funds and categories |
| Total gain | Absolute and percentage gain on the amount invested |
| 3-year return | Your weighted return against a blended benchmark — each fund compared with its own category index, then blended by weight |
| Fees this year | What you will pay in fees this year, and how much of that is above the direct plans of the same funds |
The second row covers how the funds fit together:
| Tile | What it means |
|---|---|
| Portfolio overlap | The share of value held in the same underlying stocks across your equity funds |
| Funds that act alone | The effective number of distinct portfolios once overlap is netted out |
| 10-year cost | The extra fees versus direct plans by year 10, assuming the funds grow 12% a year |
| Category fit | How far your category mix sits from our published model allocation |
5.2 Flags
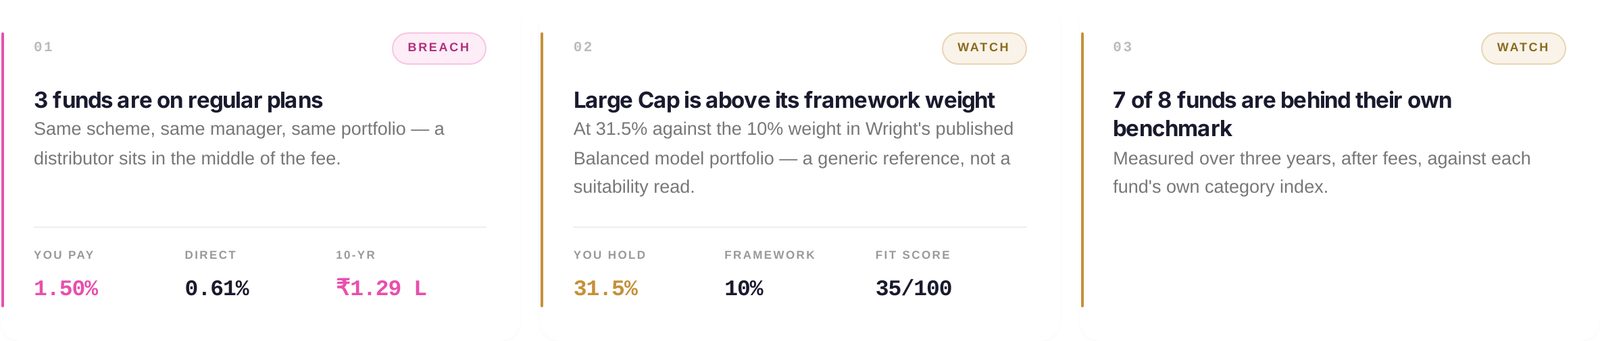
Same Breach and Watch system as equity, with the relevant numbers printed on the card — what you pay, what a direct plan charges, the ten-year cost; or your weight in a category against the framework weight and your fit score.
5.3 How much your funds repeat each other
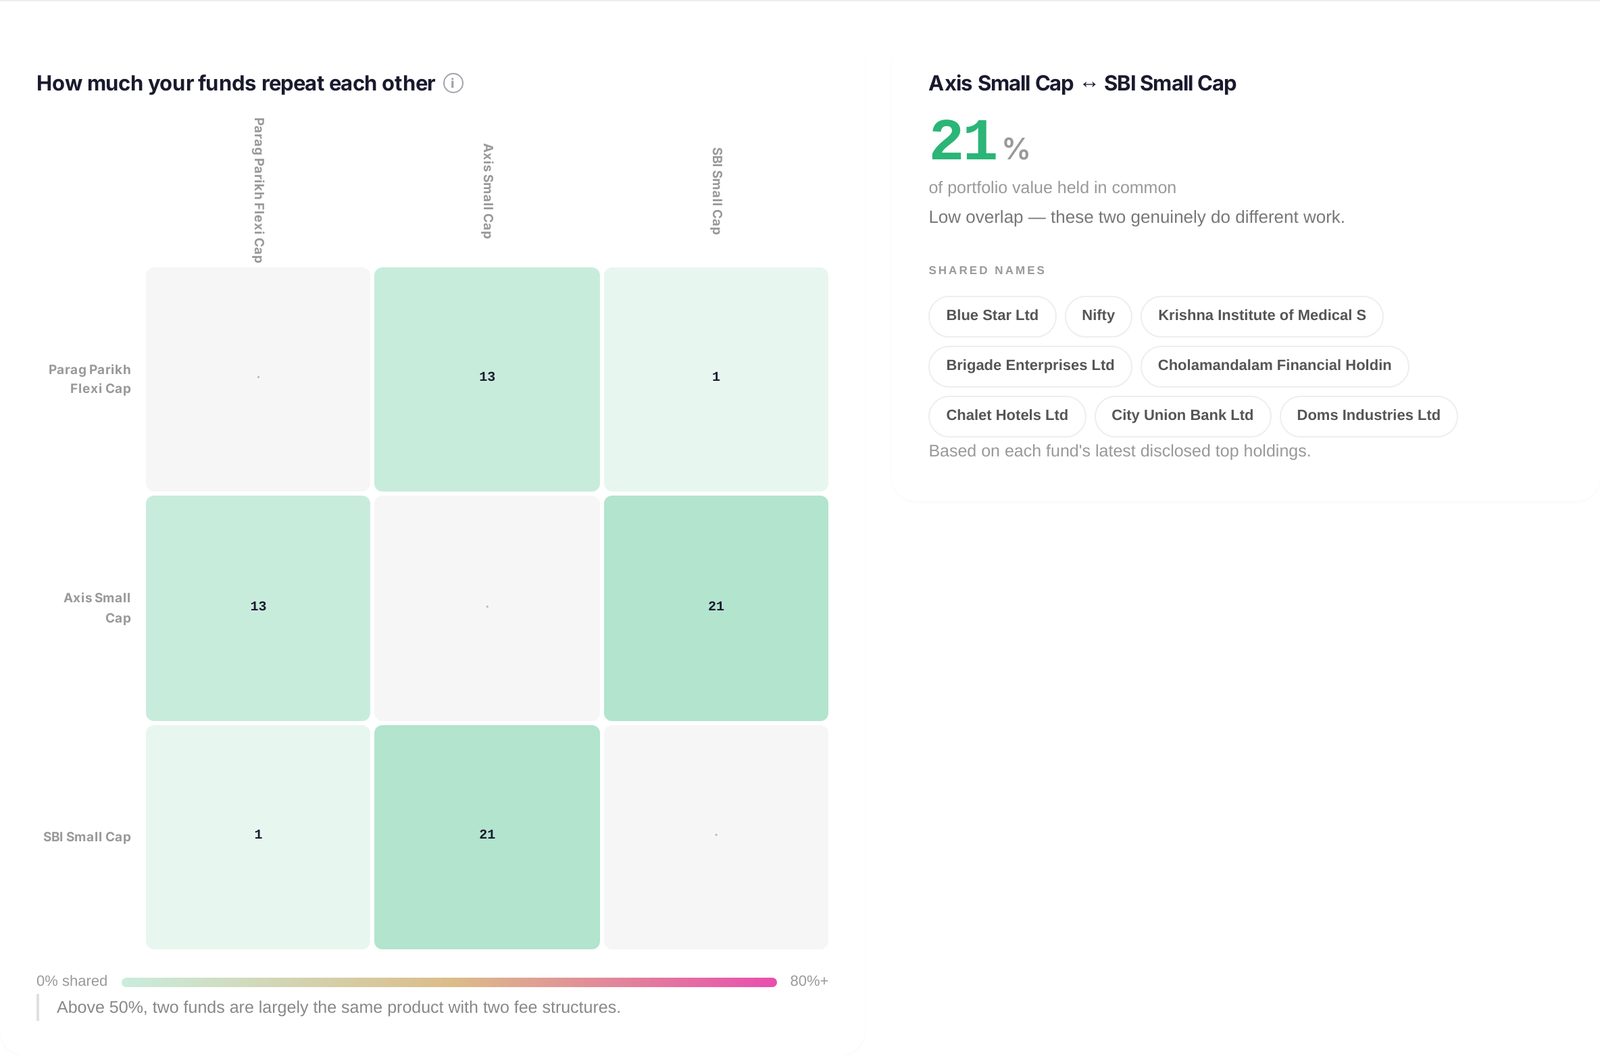
This is the section most investors have never seen. Every equity fund is compared with every other, using each fund's latest disclosed holdings. The number in a cell is the percentage of portfolio value the two funds hold in common.
The colour scale runs from 0% shared to 80%-plus. The line to remember: above 50%, two funds are largely the same product with two fee structures. Below 25%, they genuinely do different work.
Click any cell and the panel on the right lists the actual shared stocks, so you can see exactly what you are buying twice. If you hold more than ten funds, the ten largest are shown so the grid stays readable.
5.4 Your mix, and what the fees cost
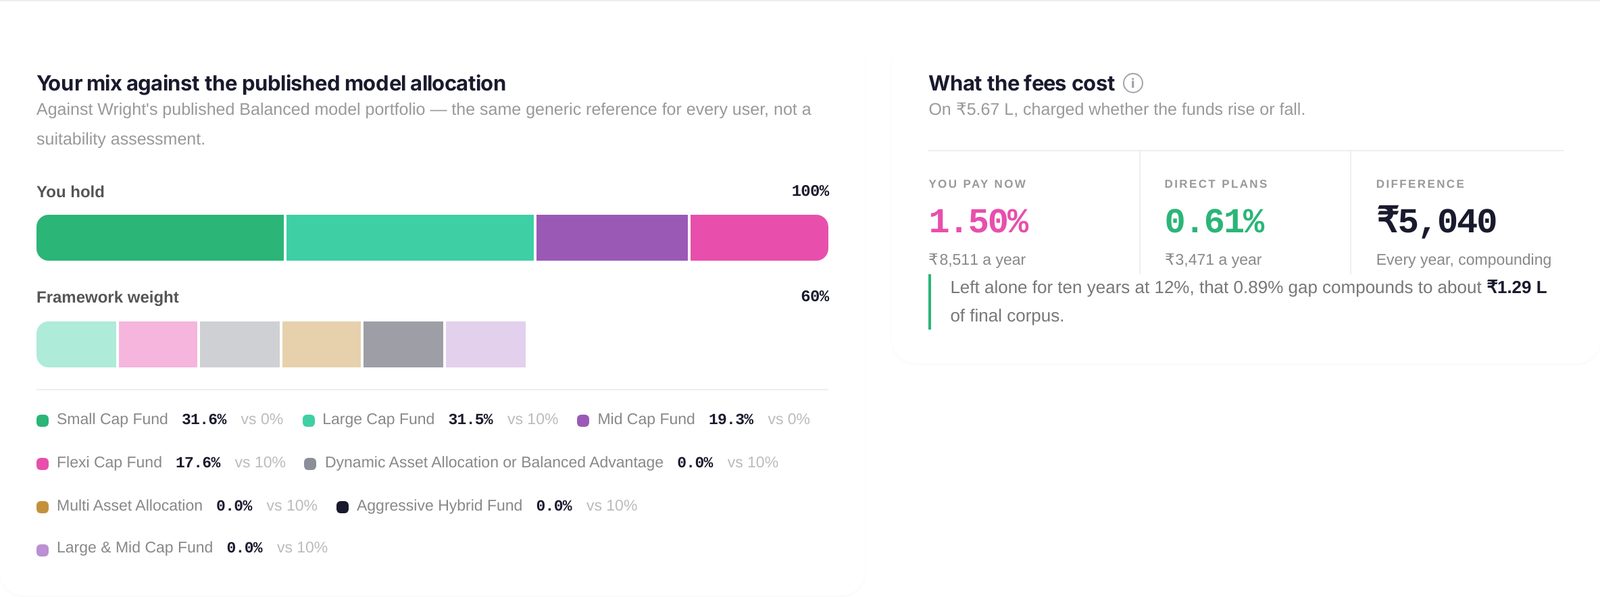
Your mix against the published model allocation. Two stacked bars: your category weights above, our published Balanced model below, with every category listed as yours vs framework. The category fit score is derived from the total deviation between the two.
This is a generic reference, not a suitability assessment. It is the same model shown to every user, and a difference is not a fault — it is a fact about how your mix differs from a published reference.
What the fees cost. Three numbers on the same holdings:
- You pay now — your weighted expense ratio, in percent and rupees per year.
- Direct plans — what the direct twin of each of your own schemes charges. Not an industry average — the same fund, same manager, same portfolio.
- Difference — the gap, per year, every year.
Underneath, the sentence that matters: left alone for ten years at 12% growth, that gap compounds to a specific rupee amount of final corpus.
5.5 Are the funds earning their fee?
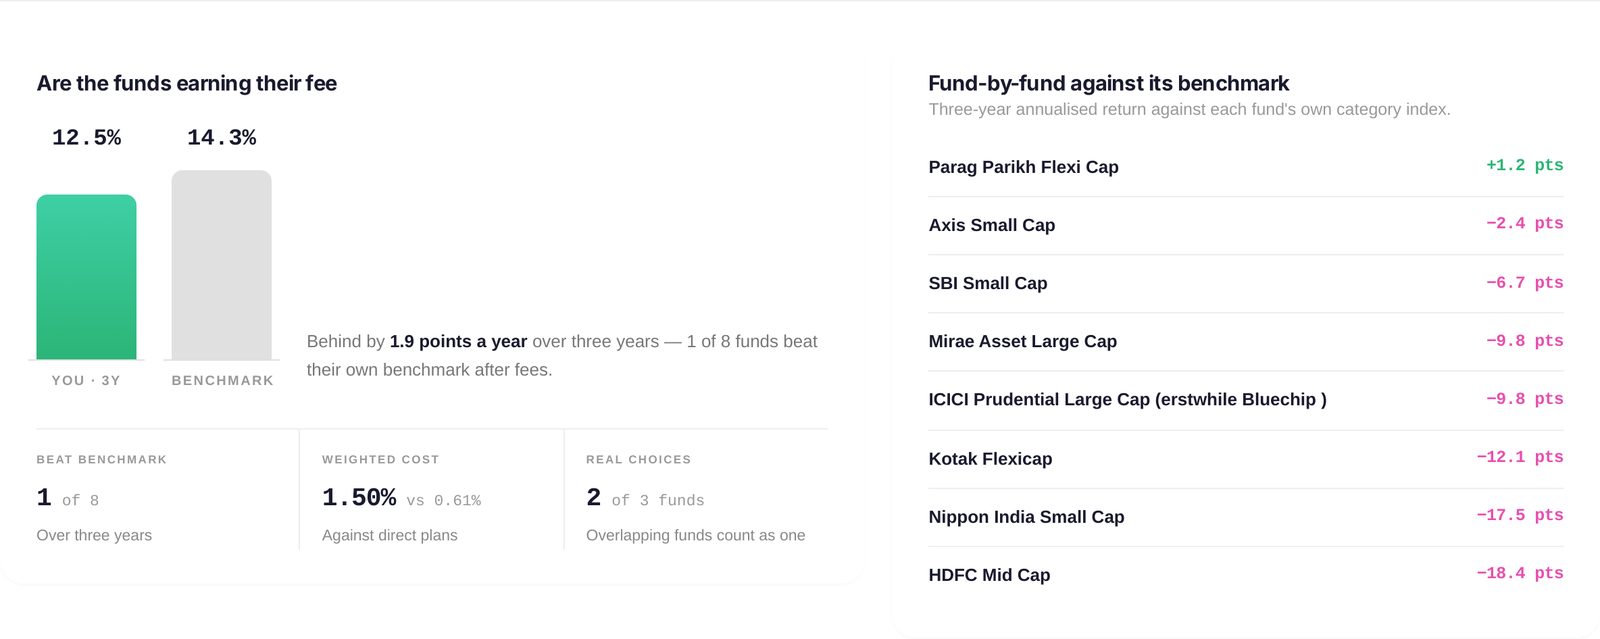
Your weighted three-year return against a blended benchmark, and — the number to look at — how many of your funds beat their own benchmark after fees.
The list beside it ranks every fund by points above or below its own category index. A fund at −9.8 points has trailed the index it is measured against by that much a year, for three years.
Three supporting figures sit below the bars: how many funds beat their benchmark, your weighted cost against direct plans, and your real choices — the effective number of funds after overlapping ones are counted as one.
5.6 What it did in past falls
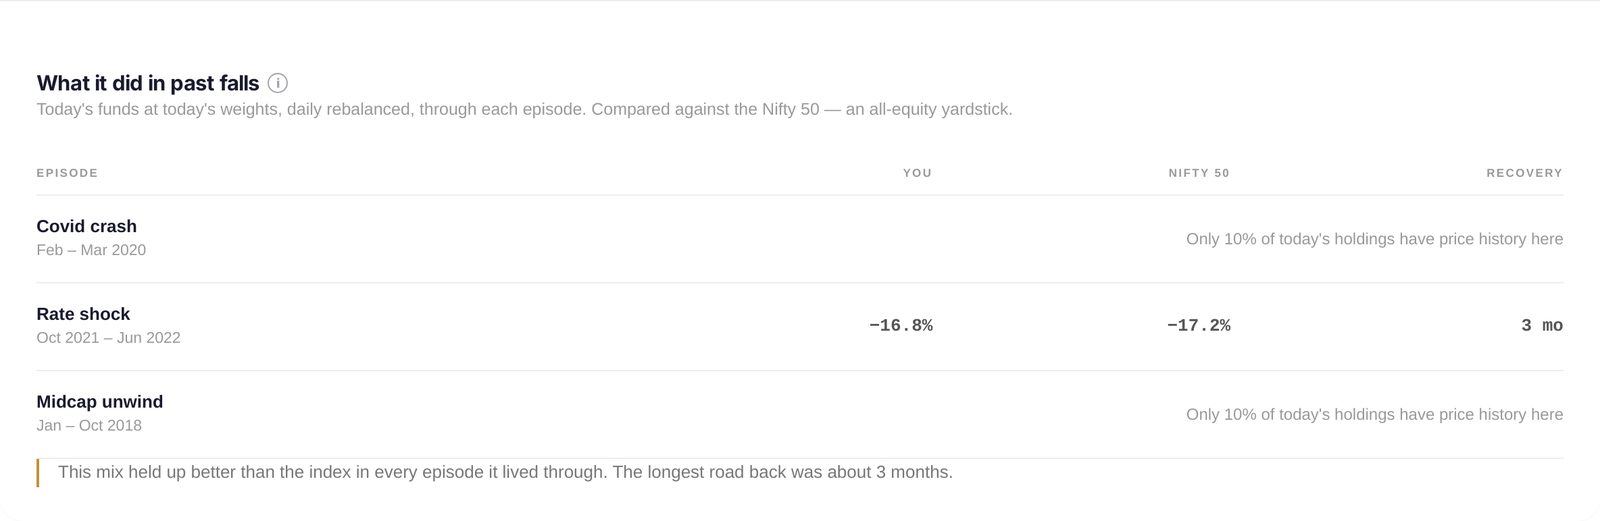
The same three episodes as the equity review, run on each fund's NAV history and compared against the Nifty 50 as an all-equity yardstick.
Funds that did not exist through an episode cannot be replayed, so where coverage is too thin the row says exactly that — for example, "Only 10% of today's holdings have price history here." That is deliberate: a partial replay presented as a full one would be misleading.
5.7 Your funds, line by line
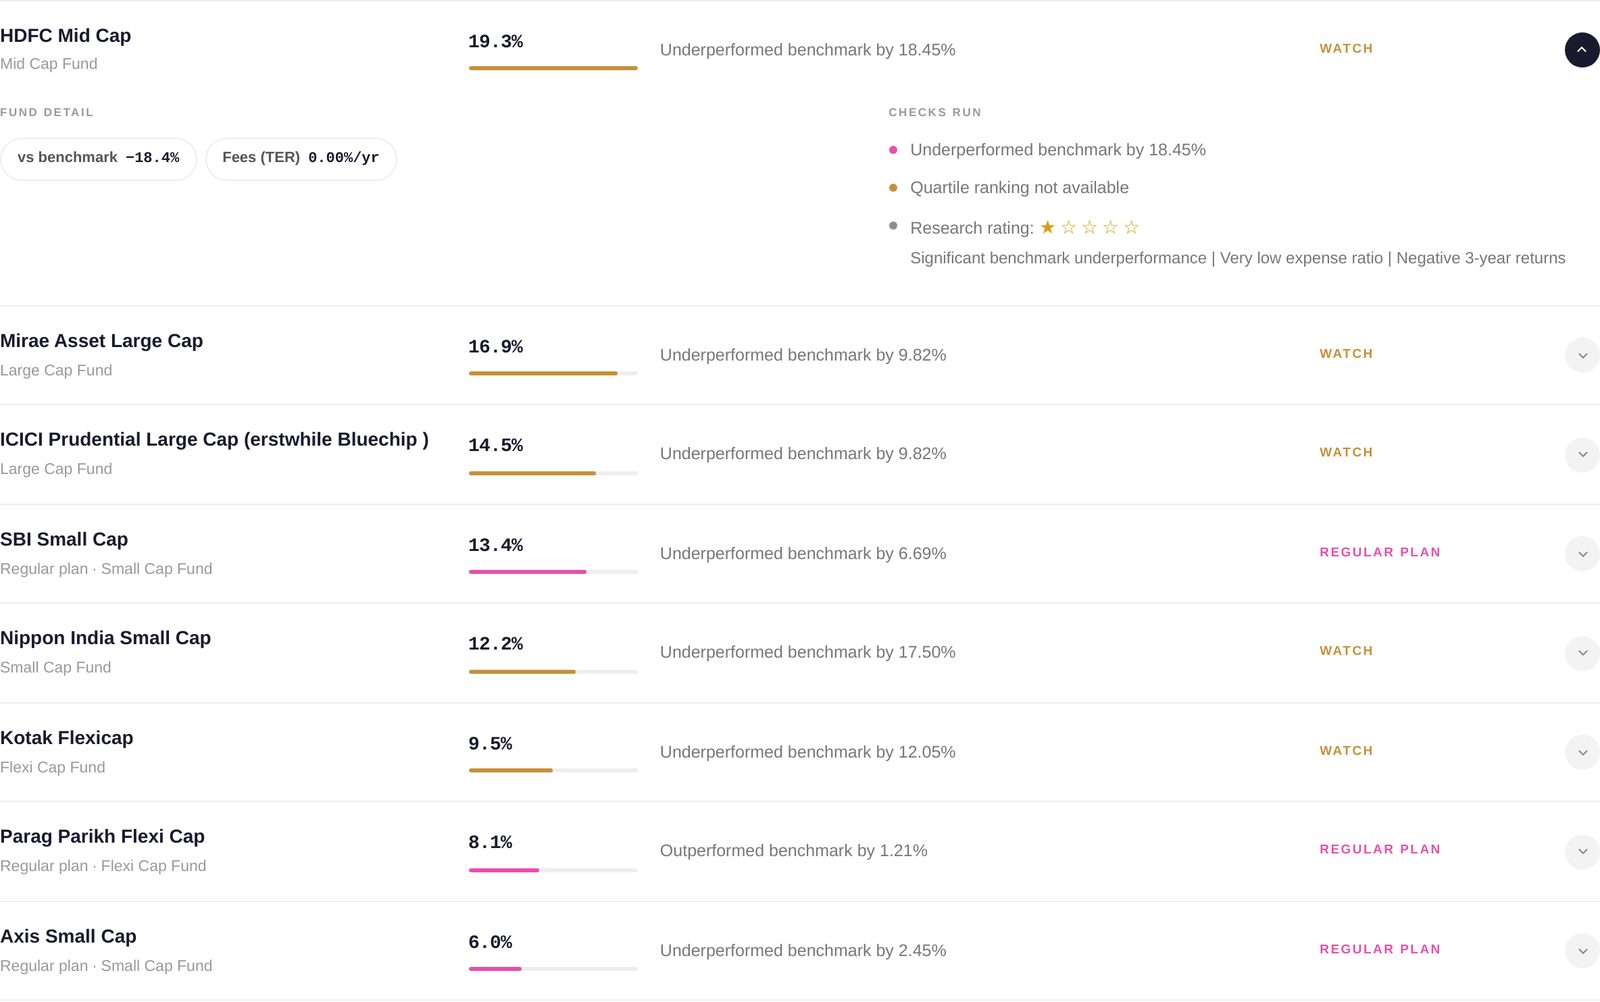
Every fund with its weight, what the checks flagged, and a chip:
- Regular plan — you are on the regular plan of a scheme that has a direct twin.
- Watch — a check fired, most often benchmark underperformance.
Click the chevron to open a row.

| Section | What it shows |
|---|---|
| Fund detail | Three-year return against benchmark, and the fund's expense ratio |
| What this fund charges you | On a regular plan, your plan against the direct plan as proportional bars, with the rupee gap on your own holding |
| Checks run | Each check as a line, then a 1–5 star research rating with the factual reasons beneath it — benchmark performance, quartile rank, expense ratio, three-year return |
6Free and full review
| Free | Full review |
|---|---|
| The hero card | Every holding and fund, line by line |
| The headline | The fee arithmetic |
| The flag summary | The overlap matrix |
| The crash replays |
To unlock the full review: book a free call, or pay ₹500. One payment covers both the equity and mutual fund reviews for a month.
Unlocking asks you to sign our Research Analyst Terms & Conditions with an email OTP. There is no KYC form and no risk questionnaire, because research does not require one.
7Glossary
| Term | What it means |
|---|---|
| ASM / GSM | Exchange surveillance lists. A stock placed on one faces additional trading restrictions |
| Benchmark | The index a fund is measured against — for a small-cap fund, a small-cap index, not the Nifty 50 |
| Beta | How much a holding or portfolio moves for a given index move. 1.00 = moves with the index |
| Correlation | How closely two holdings' daily returns track each other, from −1 to +1. Above 0.70, they behave as one position |
| Direct plan | The version of a mutual fund bought without a distributor. Same fund, same manager, lower expense ratio |
| Effective count | How many genuinely independent positions you hold, after netting down ones that move together or overlap |
| Expense ratio (TER) | The annual fee a fund charges, as a percentage of your holding. Deducted from NAV, whether the fund rises or falls |
| Factor / style | A measurable characteristic — momentum, value, growth, quality — that explains a large part of how a stock behaves |
| NAV | Net asset value: the per-unit price of a mutual fund |
| Overlap | The share of value two funds hold in the same underlying stocks |
| Quartile rank | Where a fund sits among its category peers over a period. First quartile = top 25% |
| Regular plan | The version of a fund bought through a distributor, who is paid from the fund's expense ratio |
| Risk contribution | How much of the portfolio's total risk comes from one holding — which can be far more than its weight |
| Volatility | The size of the typical swing in returns. Higher means a bumpier ride for the same destination |
8Common questions
Do I have to connect my broker or my PAN?
No. Every route is optional — you can upload a file, or type funds in by hand.
Where do my broker credentials go?
Into the broker's own login window, inside the Smallcase gateway. Wright never sees or stores them.
Some of my file didn't import. What happened?
Rows the tool could not confidently match are flagged and skipped rather than guessed at, and the counter at the top tells you how many went through. Add the missing ones manually, or correct the row in your file and upload again.
Why is my return measured on today's weights?
So that the number describes the portfolio, not your entry timing. It answers "is this mix any good", which is a different question from "how have I done".
My fund's category weight is flagged. Is that bad?
It means your weight differs from our published model allocation, which is a generic reference shown identically to every user — not an assessment of what suits you.
Is a "Watch" chip telling me to sell?
No. It records that a published check fired on that holding. The review does not make buy or sell recommendations. If you want to discuss what to do, book a call with an advisor.
How often should I re-run it?
Whenever your holdings change. The refresh button re-imports and re-scores in one step.
Does the review cover things I hold outside stocks and funds?
No — the two tabs cover listed equity and mutual funds.
9Important information
Wright Research holds SEBI Research Analyst and Portfolio Manager registrations. Portfolio Review is research and information. It is not investment advice and does not constitute a personal recommendation; no suitability assessment is performed, and all checks and reference portfolios are applied identically to every user.
Portfolio-specific advice is provided by an advisor under our PMS and advisory arrangement. Investments in securities and mutual funds are subject to market risks, including possible loss of principal. Past performance does not indicate future results, and the historical replays shown are descriptions of past episodes, not forecasts. Read all scheme-related documents carefully before investing.
The Research Analyst Terms & Conditions are linked from every review page. All figures shown in this guide are from a demonstration portfolio.


