


3 shocks arrived in the space of one week in September 2026. The US Federal Reserve raised interest rates for the first time since July 2023. Houthi forces seized the Yemeni port of Mokha and drones struck Saudi Arabia's East-West oil pipeline, the kingdom's main route for moving crude around the Strait of Hormuz. The heads of Anthropic, OpenAI and xAI publicly backed a slower pace of frontier AI development, and chip stocks fell from Seoul to Amsterdam.
Each shock travels through a different channel: the cost of money, the cost of energy and the valuation of the market's dominant growth theme. Today's newsletter explains what each development means for global markets and the world economy, and why India's domestic economy is holding up better than its currency and its benchmark index.
What did the Fed's first rate hike in three years tell markets?
The Federal Open Market Committee voted 12-0 on 16 September to raise the federal funds target range by 25 basis points to 3.75%-4%. The Fed said inflation has been too high for too long. The committee's projections explain the decision: median PCE inflation for 2026 is now 3.7%, and 16 of 18 participants expect at least one more hike before the end of the year.
Variable | 2026 (September) | 2026 (June) | 2027 (September) |
Real GDP growth | 2.3% | 2.2% | 2.4% |
Unemployment rate | 4.1% | 4.3% | 4.1% |
PCE inflation | 3.7% | 3.6% | 2.3% |
Core PCE inflation | 3.4% | 3.3% | 2.5% |
The Fed is tightening into a strong economy
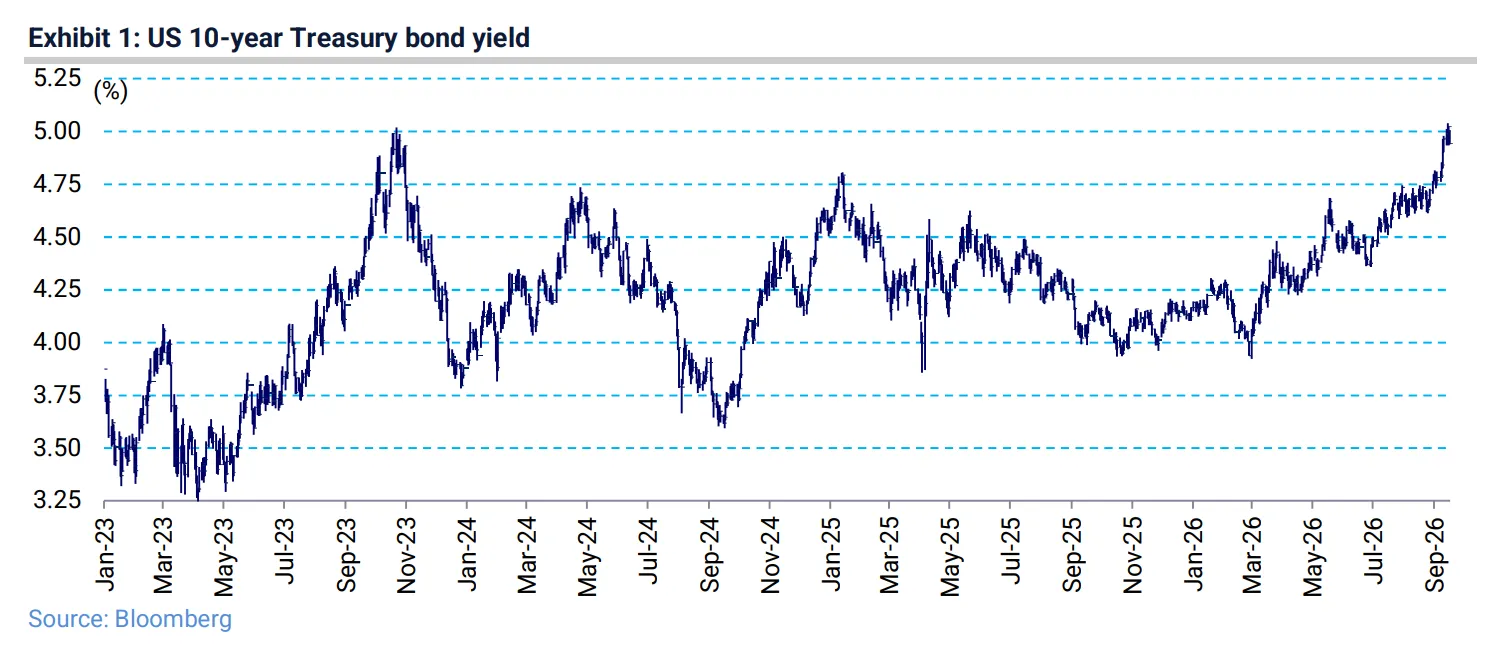
US payrolls rose by 162,000 in August against expectations of 55,000, and unemployment held at 4.1%. A firm labour market gives the Fed room to focus on inflation. The 10-year Treasury yield briefly crossed 5% and then settled near 4.95%. The hike at least prevented a further sell-off in long-dated bonds, which he expected had the Fed held. Long yields at this level raise the discount rate applied to equities everywhere, and the S&P 500 fell on the day before recovering part of the loss.
Tightening has become a global story
The Bank of Japan was widely expected to lift its policy rate to 1.25%, a 31-year high, at its meeting ending 18 September, with the 10-year Japanese government bond yield already at 3.05%.

When the Fed and the Bank of Japan tighten together, the dollar strengthens against emerging market currencies and cheap yen funding becomes scarcer. The dollar index rose to about 100.2 after the Fed decision. For emerging markets, this shrinks the pool of foreign capital willing to take currency risk in search of yield.
Check the macro backdrop
GDP, inflation, rates and more — India’s key economic indicators in one dashboard.
Why has oil become the variable that links every market?
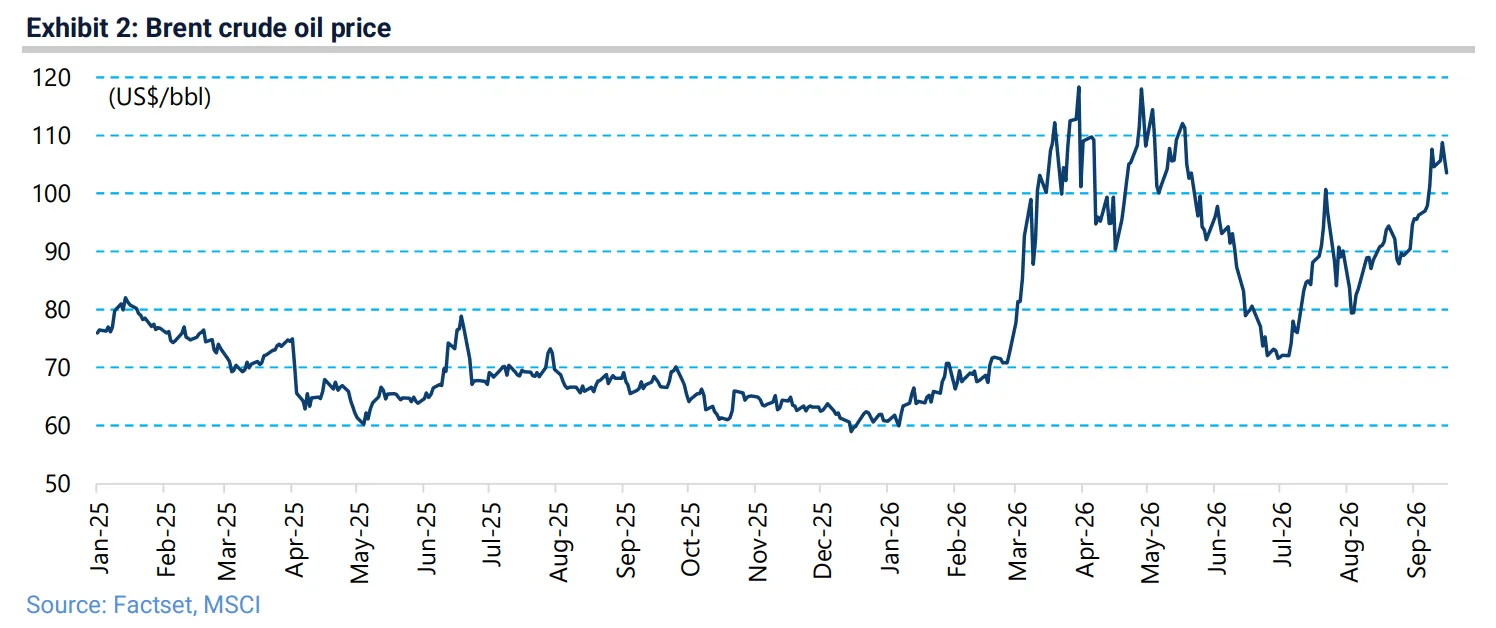
Oil sits beneath the Fed's inflation problem, India's import bill and Asia's chip supply chain. The US-Israel war with Iran, which began in February, has left the Strait of Hormuz largely closed. Saudi Arabia responded by sending crude west through its East-West pipeline to Yanbu on the Red Sea. That pipeline was shut after the 11 September drone attack, and officials expect repairs to take three to five weeks. Houthi advances around Mokha and Perim island now threaten the Bab al-Mandeb strait at the southern end of the Red Sea. Wood's summary is that Iran now controls the flow of oil out of Hormuz and the Houthis the flow out of Bab al-Mandeb.
Diesel shows the strain more clearly than crude
Brent traded near US$106 a barrel this week after reaching about US$110 on 11 September. The larger signal is in refined products. The diesel crack spread, the margin between diesel and crude oil futures, has risen above its 2022 peak.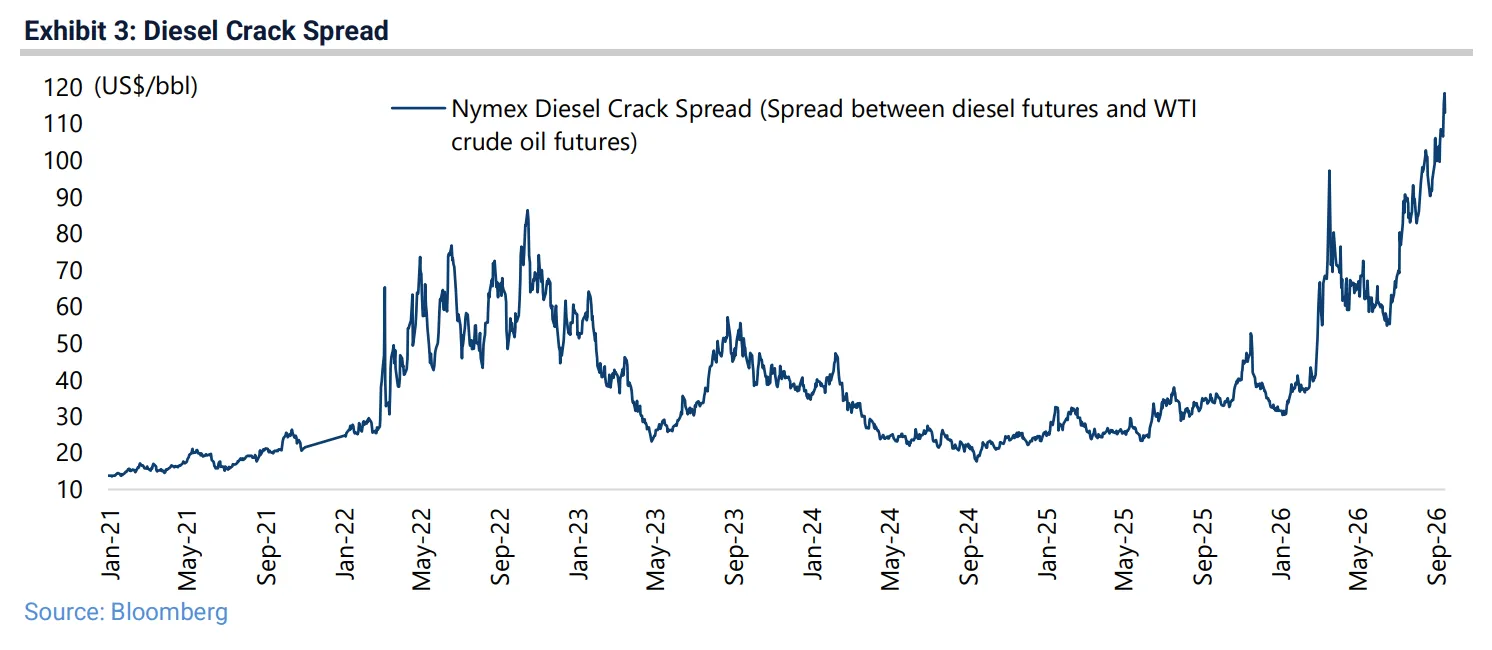
Diesel moves freight, powers farm equipment and runs backup generators, so its price reaches consumer inflation quickly. US producer prices rose 6.6% in August, and the Fed dropped its earlier description of inflation as a supply shock from its statement.
Energy also runs through the chip supply chain
South Korea imports around 70% of its crude oil from the Middle East, almost all of it through Hormuz. Samsung and SK hynix together produce roughly 80% of the world's high bandwidth memory, the chips that feed AI accelerators. A Gulf oil shock therefore reaches the AI hardware trade through the energy costs and supply lines of its largest memory makers. The geography behind today's inflation is the same geography behind semiconductor risk.
How is the AI trade shaping where emerging market money goes?
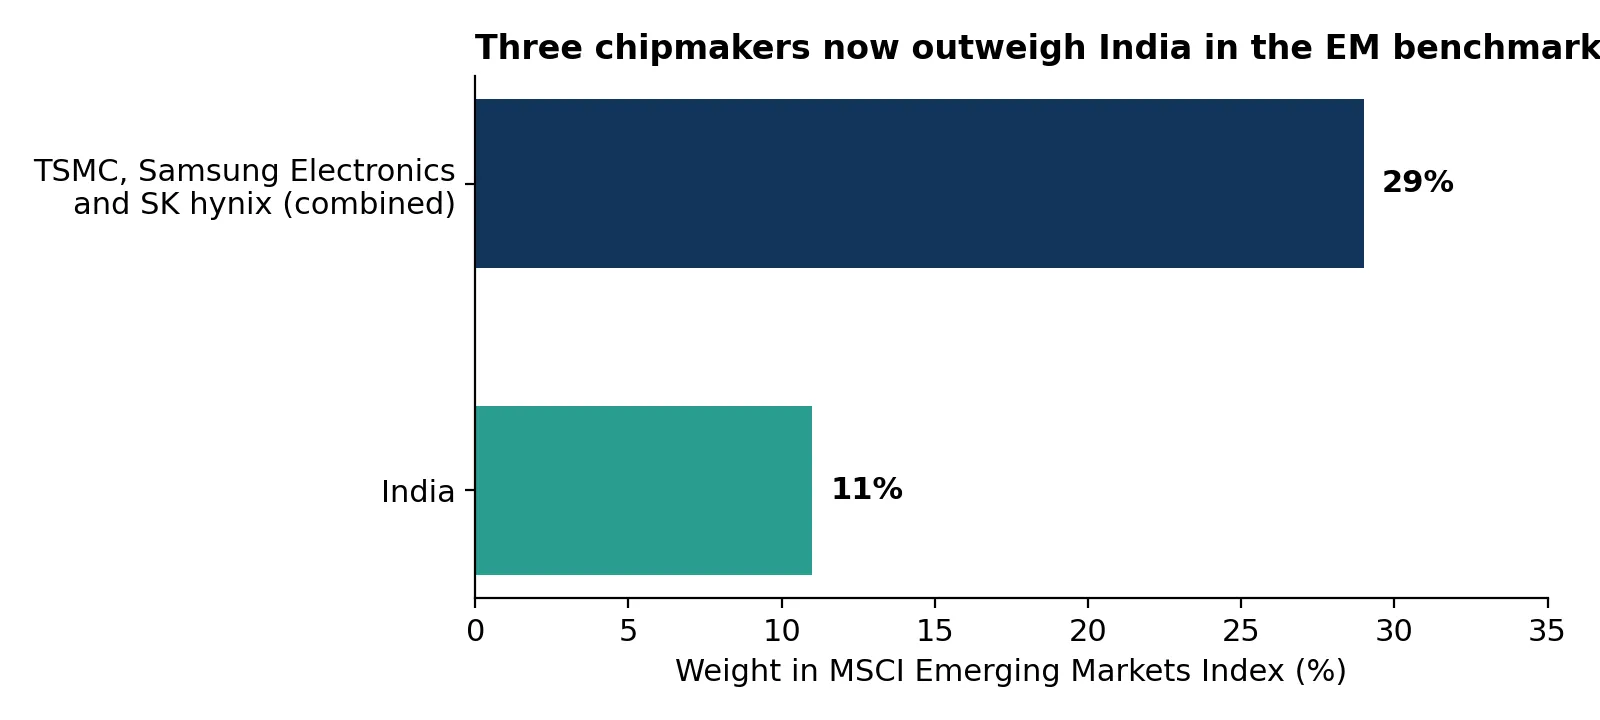
TSMC, Samsung Electronics and SK hynix now account for 29% of the MSCI Emerging Markets Index. India's weight has fallen to 11%. In early 2025, India's weight was larger than the three chipmakers combined. Funds that track the benchmark follow these weights, so strong AI hardware earnings pull emerging market allocations toward Taiwan and Korea. Here’s the weight in the MSCI Emerging Markets Index, September 2026
A slowdown debate tested the thesis
On 12 September Anthropic's Dario Amodei published an essay asking frontier AI labs to slow the rate at which model capabilities improve, so that safety testing and outside evaluation can keep up. Sam Altman and Elon Musk endorsed the call within hours. On 14 September, SK hynix fell about 5% and Kioxia close to 10% in early Asian trade, and European equipment makers followed. Altman later clarified that development would continue at a slower pace. No lab has announced a cut in capital spending, and analysts point out that demand for inference capacity still exceeds supply.
Views on the motive differ. Supporters see a response to faster capability gains and recent security incidents. Wood takes a more sceptical view, suggesting that a coordinated slowdown could build a regulatory barrier ahead of Anthropic's anticipated listing, or reflect rising compute costs. China's foreign ministry rejected the appeal outright, and Beijing is expected to continue its own AI programme at full speed.
Why the AI debate matters for India
Wood argues that India returns to the centre of emerging market portfolios only if the AI trade breaks. While AI hardware earnings keep rising, India competes for a smaller share of benchmark money. The market reaction in mid-September showed how fast that balance can move. Memory is the most cyclical part of the chip industry, and any slowdown in AI spending would reach Korean and Taiwanese earnings first.
Get research like this in your inbox
The week’s research that mattered, in five minutes. Joined by 2L+ investors.
What is keeping India's domestic economy steady?
Credit, consumption and electricity demand all point to an economy growing on its own momentum - real GDP growth of 6.5% to 7% and nominal growth of 11% to 12% in the current fiscal year.
Credit is carrying growth
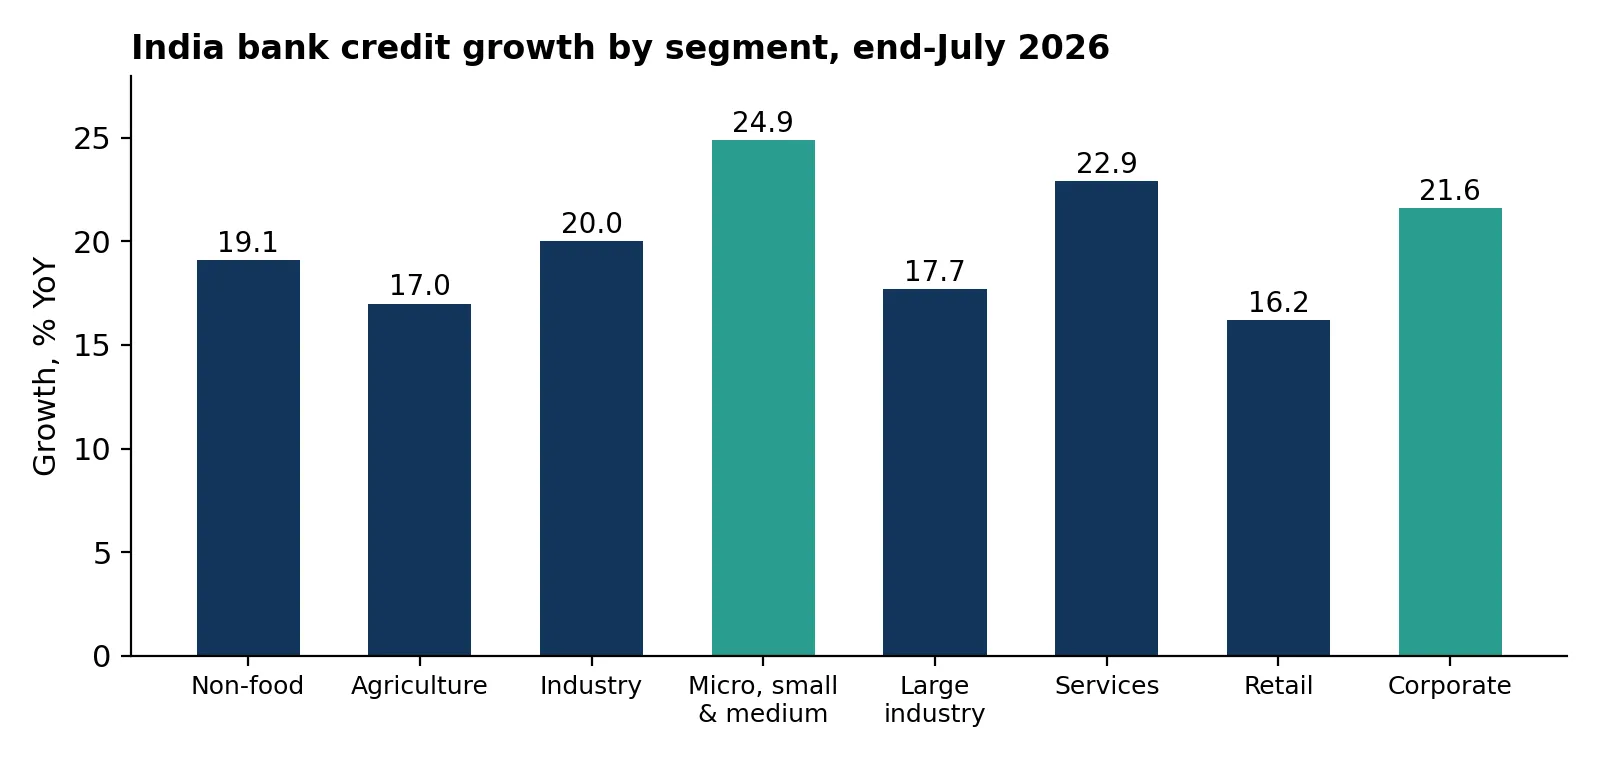
Bank credit grew 19.1% year on year at the end of August, with deposits up 17.8%. Loans to micro, small and medium enterprises rose 24.9% and corporate loans 21.6%. Lending to smaller firms at this pace suggests that the GST and labour reforms introduced in late 2025 are starting to pay off. Bankers also report that the long-awaited private sector investment cycle has begun.
Consumption and power demand confirm the trend
GST collections rose 14.8% in August. Power demand growth rose from 1.8% in January to March to 9.4% in April to August. Households have also been able to borrow against their gold as prices climbed, with organised gold loans reaching US$197 billion in March 2026.
Energy sourcing has been rearranged
Russia's share of India's crude imports rose from 20% in February to over 50% in July, and India has also bought more US energy. The central government has kept its fiscal deficit target of 4.3% of GDP despite higher fuel subsidies. These choices have limited supply disruption, although India remains a large oil importer and every rise in Brent widens its import bill.
Where is the pressure showing up in India?
The pressure is concentrated in the currency and in foreign portfolio flows.
Foreign investors are selling again
Foreign portfolio investors have sold about ₹2.4 lakh crore of Indian equities in 2026, already more than the ₹1.66 lakh crore sold in all of 2025. Net buying in July and August reversed in September as crude, US yields and the dollar rose together. The rupee has weakened past 96 per dollar. The gap between India's repo rate of 5.25% and the top of the Fed's range is now 125 basis points, well below its average of the past decade, which reduces the reward for holding rupee assets.
The RBI is moving toward a rate hike
Economists see a higher probability of a Reserve Bank of India hike in October, citing firm crude prices and rising headline and core inflation. CPI inflation was 4.8% in August. The market is expecting 50 basis points of hikes by the end of the year. The complication is liquidity. The banking system remains in surplus, and the weighted average call rate sits at 5.05%, below the repo rate. A hike will transmit to borrowing costs only once surplus liquidity is drawn down toward about 1% of banks' deposit base. On the positive side, the foreign currency deposit scheme for non-resident Indians raised about US$136 billion, which gives the RBI reserves to steady the rupee.
Shock | Global channel | India channel | Buffer |
Fed hike | Higher Treasury yields, stronger dollar | Foreign selling, narrower rate gap, weaker rupee | NRI deposits of US$136bn, likely RBI hike |
Red Sea and Hormuz disruption | Higher crude and diesel prices, sticky inflation | Import bill, CPI, fuel subsidies | Russian and US crude, fiscal target held |
AI slowdown debate | Volatility in chip and memory stocks | Shifts in EM benchmark weights | Domestic fund flows, low AI exposure |
What does this mean for Indian stocks?
India's market reflects a contest between domestic savings and new share supply. The Nifty closed at 23,398 on 11 September and is down about 11% this year, while the Nifty Midcap 100 is up 1.5%.
Domestic money absorbs foreign selling
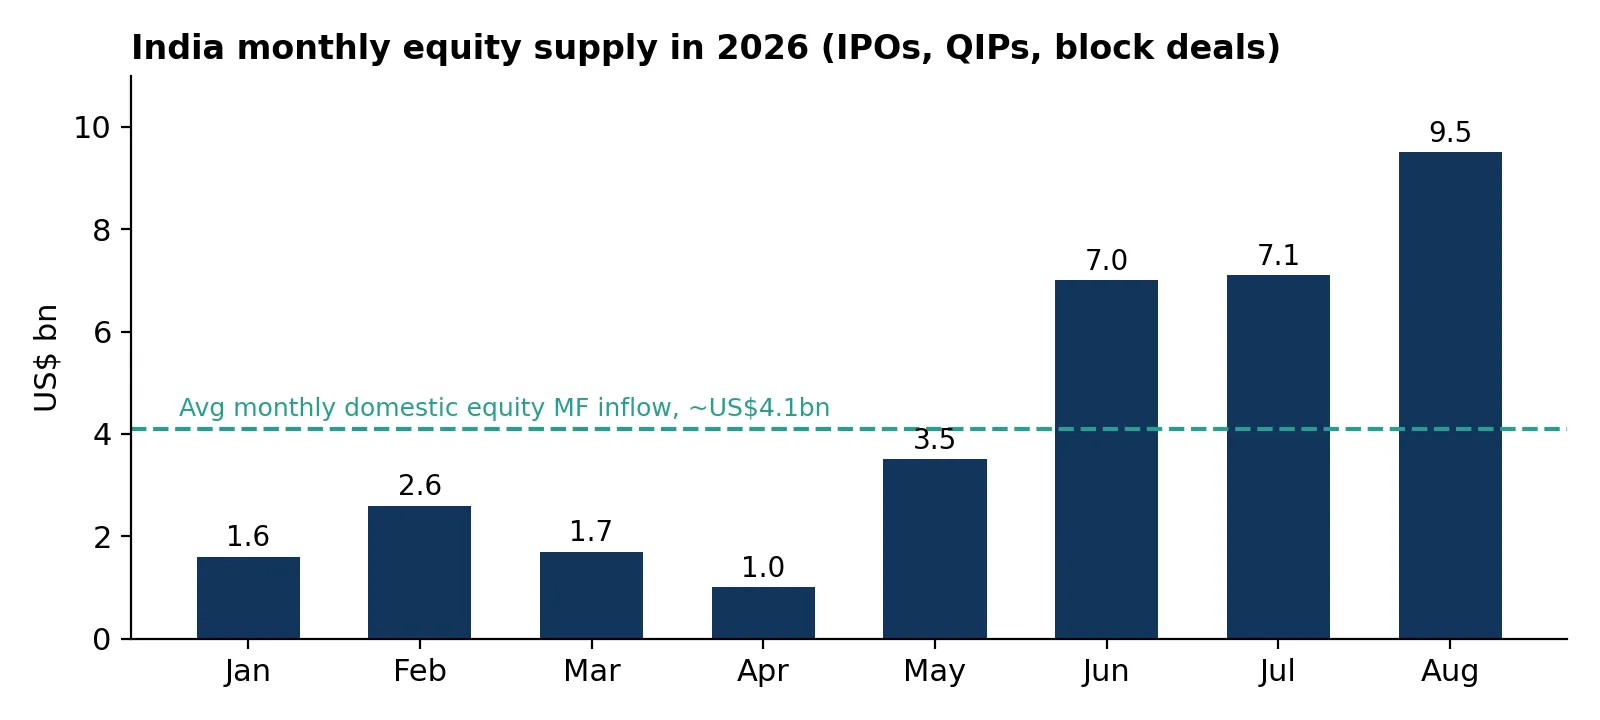
Net inflows into domestic equity mutual funds have averaged about ₹388 billion (US$4.1 billion) a month in 2026. That money has absorbed foreign selling. It has also been absorbed in turn by new issuance. Monthly equity supply from IPOs, share sales and promoter and private equity blocks fell to US$1 billion in April after the Iran war began, then rebounded to US$9.5 billion in August. That supply caps the upside of the benchmark index.
Earnings growth is expected to pick up
Earnings growth is expected to grow by 14% this fiscal year, rising to 17% next year as nominal GDP accelerates. The Nifty trades at 17.3 times forward earnings and the Nifty Midcap 100 at 26.3 times. Large caps offer the lower entry valuation. Mid and small caps offer exposure to India's entrepreneurial depth, which Wood continues to favour, and their returns depend on earnings arriving as forecast.
See what markets are pricing in
Live indices, sector moves and market breadth — the backdrop to every story we publish.
Which signals will decide the next six months?
Five indicators will show whether domestic strength can keep offsetting external pressure. The first is the Fed's December meeting and whether the 10-year Treasury yield stays near 5%. The second is the repair of the East-West pipeline and the security of shipping through Bab al-Mandeb, which together set the path for Brent and diesel. The third is the RBI's October decision and its success in draining surplus liquidity. The fourth is capital spending guidance from the large US cloud providers in their next results, which will show whether the AI slowdown debate changes budgets. The fifth is the balance between foreign selling, domestic fund inflows and new equity supply.
India's growth rests on domestic credit and consumption, and both are holding. Its currency and its large-cap index depend on global capital, which higher US yields and AI hardware are currently pulling elsewhere. The question for investors is how long domestic strength can hold the line until one of the three shocks eases.


