


Gold and silver often respond to the same forces—interest rates, the US dollar, inflation expectations and investor risk appetite—but they do not move in lockstep. Gold has a deep monetary and reserve role; silver also has substantial industrial demand. Their relative price can therefore reveal how markets are balancing safety, growth and commodity cycles.
This guide explains the calculation, interpretation and limits of the ratio without treating any level as an automatic trading signal.
What Is the Gold-to-Silver Ratio?
The gold silver ratio shows how many units of silver are needed to equal the price of one equivalent unit of gold. If gold costs 80 times as much as silver per ounce, the ratio is 80. A higher reading means gold is expensive relative to silver; a lower reading means silver is expensive relative to gold.
The essential gold silver ratio meaning is relative—not absolute—value. It does not say that either metal is cheap in rupees or dollars. Both can rise while the ratio falls if silver rises faster, and both can fall while the ratio rises if silver falls faster.
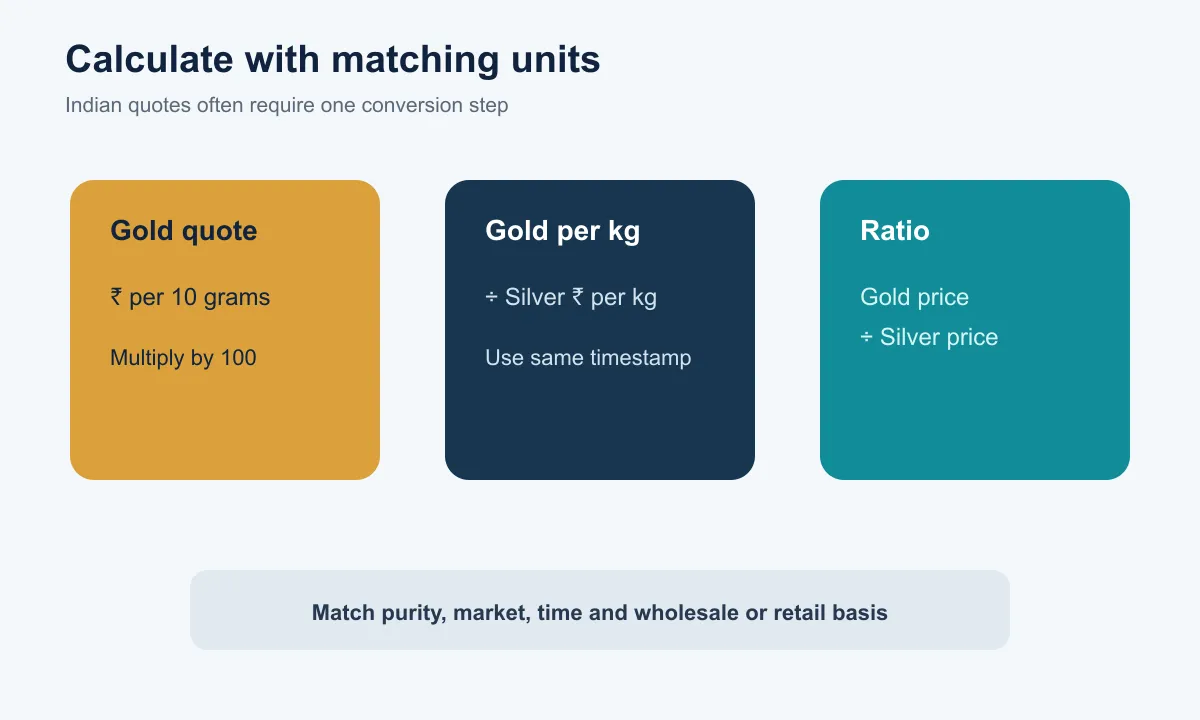
Use matching units, purity, market, time and price type. Comparing a retail jewellery quote with a wholesale silver price creates a distorted result because taxes, fabrication charges, purity and dealer spreads differ.
Check the macro backdrop
GDP, inflation, rates and more — India’s key economic indicators in one dashboard.
How to Calculate the Ratio
The gold silver ratio formula is:
Gold price per unit ÷ silver price per the same unit
International markets commonly use US dollars per troy ounce. Indian benchmark quotations often show gold per 10 grams and silver per kilogram, so the units must first be aligned. Convert gold to a per-kilogram price by multiplying the 10-gram quote by 100, then divide by the silver-per-kilogram quote.
For example, if 999-purity gold is ₹1,20,000 per 10 grams and 999-purity silver is ₹1,50,000 per kilogram:
- Gold per kilogram = ₹1,20,000 × 100 = ₹1,20,00,000
- Ratio = ₹1,20,00,000 ÷ ₹1,50,000 = 80
The result is dimensionless. The same-time gold to silver ratio India calculation should broadly resemble the global ratio after currency conversion, provided the prices represent comparable purity and wholesale terms.
What a High or Low Ratio Can Signal
A high reading means gold has outperformed silver over the comparison period. It can occur when investors prefer liquidity and perceived safety, when industrial expectations weaken, or when silver-specific supply and demand are soft. Some investors interpret it as silver being relatively inexpensive, but the ratio can remain high or move higher.
A low reading means silver has outperformed gold. This may coincide with stronger manufacturing expectations, speculative demand or a broad precious-metals rally in which silver’s higher volatility becomes more visible. It does not prove gold is undervalued or that silver must decline.
| Ratio direction | Relative move | Possible context—not a certainty |
|---|---|---|
| Rising | Gold outperforming silver | Defensive demand, weaker industrial outlook or silver underperformance |
| Falling | Silver outperforming gold | Stronger cyclical demand, higher risk appetite or silver catch-up |
| Stable | Similar relative performance | Shared macro drivers dominate |
Anyone learning how to use gold silver ratio should focus on direction, speed and historical context rather than a single threshold.
Historical Gold-Silver Ratio: What Investors Should Learn
The historical gold silver ratio has varied widely across monetary systems, market structures and economic regimes. Fixed relationships from centuries ago are not reliable anchors for modern markets because currencies are no longer generally tied to bimetallic standards, and industrial use has changed.
Extreme moves often occur during stress. Gold’s deeper market and safe-haven role can attract capital faster than silver, while industrial concerns may simultaneously weigh on silver. Later, silver can move more sharply when risk appetite or commodity demand recovers.
The lesson is not that every historical extreme must reverse to a fixed average. A useful comparison uses a consistent price series and examines percentiles over several horizons. The historical gold silver ratio can define what is unusual relative to a chosen sample, but structural change can shift the distribution.
Get research like this in your inbox
The week’s research that mattered, in five minutes. Joined by 2L+ investors.
Gold vs Silver: Why the Ratio Changes
Gold demand comes from investment, central banks, jewellery and technology. It is widely held as a reserve and portfolio diversifier. Silver is also a precious metal, but industrial applications are much more influential.
The Silver Institute reports major uses in electronics, solar photovoltaics, vehicles, grid infrastructure and other technologies. The World Gold Council’s long-horizon analysis describes silver as having higher sensitivity to gold, with an average beta around 1.3 over the examined period. That helps explain why silver often amplifies precious-metal moves in both directions.
| Driver | Gold sensitivity | Silver sensitivity |
|---|---|---|
| Safe-haven demand | Usually stronger | Present but less dominant |
| Industrial cycle | Limited direct role | Material role |
| Central-bank demand | Important | Minimal |
| Market depth and liquidity | Deeper | Smaller market |
| Volatility | Generally lower | Generally higher |
A gold vs silver investment decision therefore involves more than relative price. Gold may serve as a strategic diversifier; silver may behave as a higher-volatility blend of precious and industrial metal exposure.
How Indian Investors Can Use the Ratio
For Indian investors, the ratio can support three tasks: monitoring relative momentum, reviewing an existing metals allocation and testing whether a planned purchase would make the portfolio too concentrated in one metal.
Start with comparable Indian benchmark or MCX prices. Wright Research’s India macro indicators can place the signal alongside the rupee, inflation and interest-rate context. The market dashboards can help avoid reading it in isolation.
The gold to silver ratio India investors calculate in rupees may differ temporarily from an international ratio because of local premiums, taxes, contract timing, import conditions and liquidity. However, if both global prices are converted using the same exchange rate, the currency factor largely cancels mathematically.
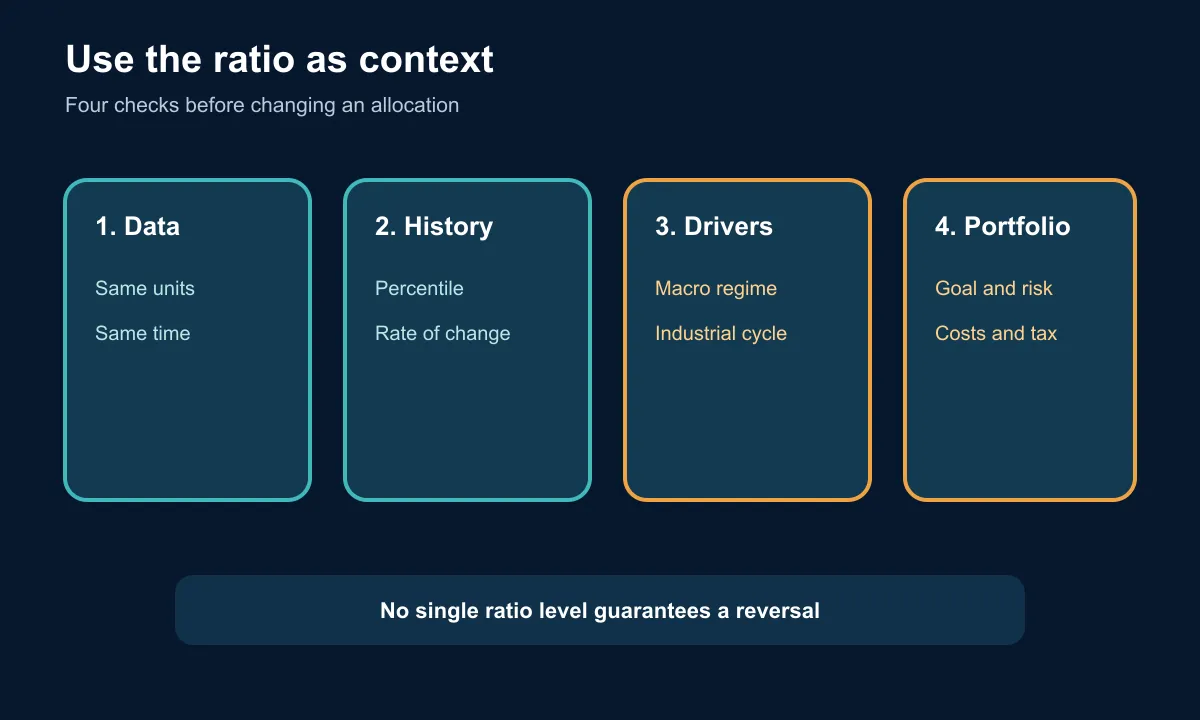
Practical gold silver ratio investing uses might include setting review bands rather than automatic orders, comparing the current observation with its multi-year percentile, and checking whether a relative signal aligns with industrial and macro evidence.
Ratio-Based Strategies: Benefits and Limitations
One approach rebalances between gold and silver when the measure moves beyond predefined historical bands. Another uses it only as a confirmation signal before changing a strategic metals allocation. A relative-value trader may take opposite positions in the two metals, but that adds leverage, basis, margin and execution risk.
Benefits include a clear formula, a long observable history and focus on relative rather than outright price. Limitations are more important:
- No universally correct high or low threshold exists.
- Structural industrial changes can shift silver’s relationship with gold.
- Transaction costs, GST, spreads, fund expenses and taxes can overwhelm small signals.
- Physical products may use incompatible purity and retail premiums.
- The ratio can become more extreme before reverting, or never return to a chosen average.
- Different instruments—physical metal, ETFs and futures—introduce tracking and liquidity differences.
For most diversified investors, gold silver ratio investing is better treated as a review framework than a complete strategy. Wright Research’s analysis of metals as macro signals provides wider context.
Worked Example Using Gold and Silver Prices
Suppose comparable Indian prices are:
- Gold 999: ₹1,35,000 per 10 grams
- Silver 999: ₹1,80,000 per kilogram
Using the gold silver ratio formula:
- Convert gold to one kilogram: ₹1,35,000 × 100 = ₹1,35,00,000.
- Divide by silver: ₹1,35,00,000 ÷ ₹1,80,000 = 75.
The reading says one kilogram of gold costs the same as 75 kilograms of silver on the selected quotes. If gold later rises 5% and silver rises 10%, the ratio falls to about 71.6 because silver outperformed. This is a gold vs silver investment observation, not proof that either metal will continue moving.
See what markets are pricing in
Live indices, sector moves and market breadth — the backdrop to every story we publish.
FAQ
Does India's gold-silver ratio differ from the global ratio?
It can differ temporarily because Indian quotations include local premiums, taxes, import conditions, trading hours and liquidity. Use matching purity, units and timestamps. Wholesale-equivalent ratios should generally remain connected through arbitrage and currency conversion.
How do rupee movements affect the gold-silver ratio for Indian investors?
If identical global gold and silver prices are converted into rupees at the same exchange rate, that common currency factor cancels in the ratio. In practice, local premiums and each metal’s market conditions can create differences.
Is the gold-silver ratio more useful for short-term trading or long-term allocation?
It can inform both, but the implementation differs. Traders focus on momentum and execution; long-term investors may use historical percentiles as a periodic allocation review. Neither use eliminates timing or structural-change risk.
Should investors rebalance gold and silver holdings based only on the ratio?
No. Portfolio role, risk tolerance, liquidity needs, costs, taxes and macro conditions also matter. A relative-price observation is insufficient on its own to justify a transaction.
The gold silver ratio meaning is clearest when treated as evidence about relative performance. It is useful for asking better questions, not for replacing portfolio analysis.


