

In the Indian equity market, investors face a choice between small-cap and large-cap stocks, each with unique return potentials. Small-cap stocks, representing companies with smaller market capitalizations and in growth stages, offer high returns but are riskier. They surged by about 40% last year, outperforming larger stocks. However, this growth has increased their valuation, potentially limiting future gains. Large-cap stocks, from well-established companies, are traditionally seen as safer, providing stability and steady returns. Despite this, their growth has been more modest recently, around 10 to 12% in the last year, impacted by competitive and innovative market forces.
Investors should consider market conditions, economic indicators, and sectoral potential when deciding between small-cap and large-cap stocks. Diversification and understanding company fundamentals are key in managing risks associated with both. While small-caps have shown high returns recently, their inherent risks compared to the stability of large-caps should be a crucial consideration for investors. In today’s article we will compare large cap stocks against mid cap stocks and small cap stocks performance and explore diversification benefits in different market regimes.
We will also look at the concept of diversification ratio within a portfolio which is key to managing risk while aiming for maximum return potential. It is a critical tool for investors to balance their exposure across different market caps.
Returns in Years with Positive Nifty Returns vs Negative
Let’s do a comparative analysis of returns for large, mid, and small-cap stocks during years with positive and negative Nifty returns. In years when the Nifty returns were positive, small-cap stocks showed the highest returns at approximately 33.98%, followed by mid-caps at around 30.98%, with large-caps trailing at about 24.20%. This trend suggests that smaller companies tend to benefit more in bullish market conditions, potentially due to their capacity for rapid growth and scaling, which can result in outsized returns.
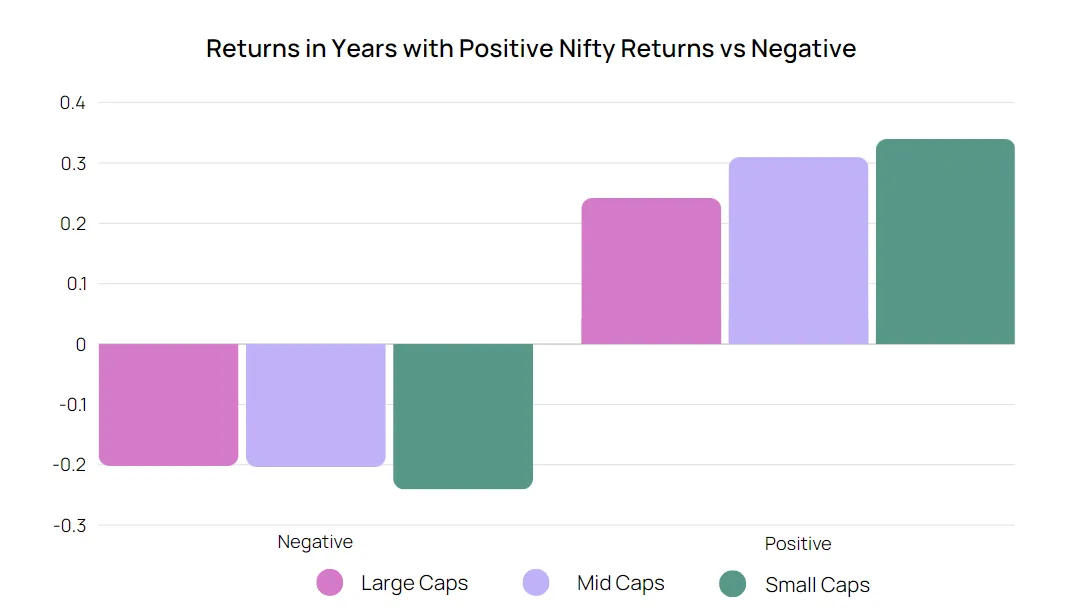
Conversely, during years with negative Nifty returns, all categories suffered losses, with small-caps incurring the highest at roughly -24.08%, mid-caps at -20.37%, and large-caps showing the least negative impact at -20.20%. This indicates that in bearish markets, large-cap stocks are somewhat more resilient, likely due to their established market presence and financial stability, which can help cushion against downturns.
There is an inherent risk-reward trade-off between large caps, mid caps and small caps. While small-caps can provide substantial growth in favorable conditions, they also carry greater risk during market downturns. Investors looking for growth and able to tolerate volatility might favor small-caps in positive markets, whereas those seeking preservation of capital in uncertain times might lean towards large-caps.
Diversification Ratio for Years with Positive Nifty Returns vs Negative
When examining returns in varying Nifty conditions, the diversification ratio in a portfolio should account for the different risk profiles and performance of market cap segments. In positive years, small-caps have soared, indicating the utility of a higher small-cap ratio in bullish conditions. However, the significant losses in negative years point to the need for a stabilizing large-cap presence. The optimal diversification ratio should thus be flexible, increasing exposure to small-caps in anticipation of market upswings, while anchoring the portfolio with large-caps to weather downturns.
See what markets are pricing in
Live indices, sector moves and market breadth — the backdrop to every story we publish.
How does Volatility Impact return performance across different market caps - Large, Mid & Small Caps?
We can compare the returns of large, mid, and small-cap stocks during years with high volatility versus low volatility. Small-cap stocks outperform in both scenarios, delivering 26.77% returns in high volatility years and 20.99% in low volatility ones. This demonstrates the high-risk, high-reward nature of small-cap investments, where volatility can amplify returns due to rapid price movements influenced by market sentiment and speculative trading.
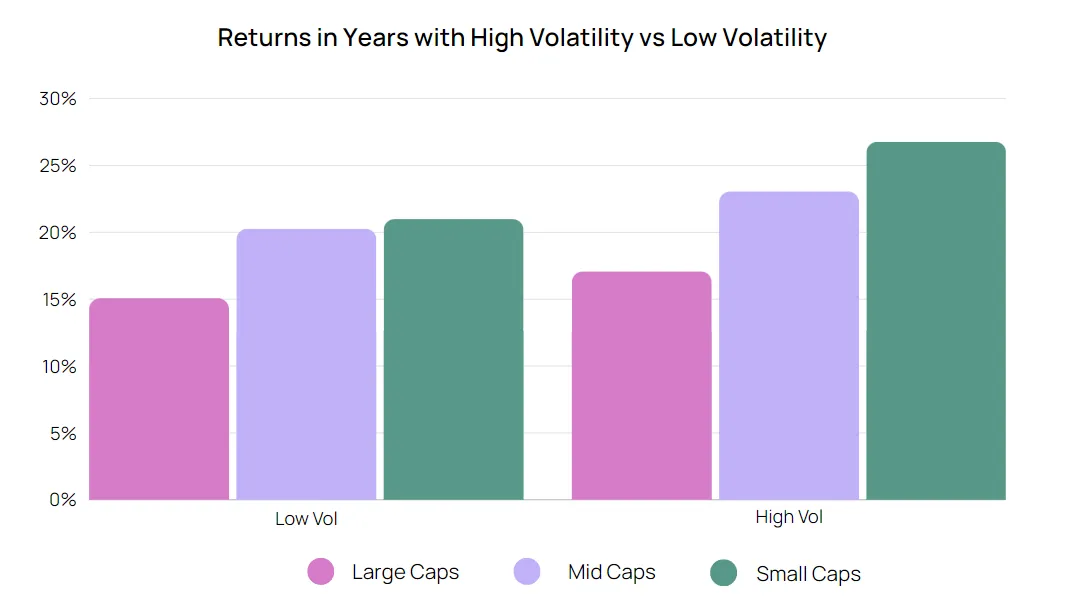
Mid-cap stocks also show a significant increase from 20.27% in low volatility years to 23.05% in high volatility years. This suggests that mid-caps, while less volatile than small-caps, still benefit from market fluctuations to a considerable degree, possibly due to a blend of growth potential and established market presence. Large-cap stocks, perceived as the most stable, show the smallest increase in returns from low to high volatility, from 15.07% to 17.08%. This smaller differential indicates their robustness in the face of market fluctuations, due to their size, established operations, and often more diversified revenue streams.
It’s evident that the performance gap between large, mid, and small-cap stocks widens in positive market conditions. Yet, during downturns or high volatility, this gap seems to narrow, especially between large and mid-cap stocks. This could imply that while small-caps have higher growth potential during market upswings, large and mid-cap stocks offer more protection in uncertain times, balancing out their performance across different market conditions.
Diversification Ratio With Volatility
Volatility's impact on returns suggests a diversification ratio that can adapt to market conditions. The substantial gains in small-caps during both high and low volatility underscore the potential for higher allocations in tumultuous times, assuming an investor’s risk tolerance aligns. For risk-averse investors, maintaining a higher ratio of large-caps, which are less impacted by volatility, can provide a steadier performance. A strategic diversification ratio should aim to capture the growth of small and mid-caps during volatility while maintaining a core stability through large-cap stocks.
What should happen in different market regimes?
Different market regimes need different ways to build your portfolio & allocate your capital. The graph below suggests that the market has experienced several cycles of growth and retraction, with the bullish periods generally leading to higher market indices, while bearish periods are characterized by declines or sideways movements. We can distinguish between bullish (upward-trending, depicted in blue) and bearish (downward-trending, depicted in red) periods in the market.
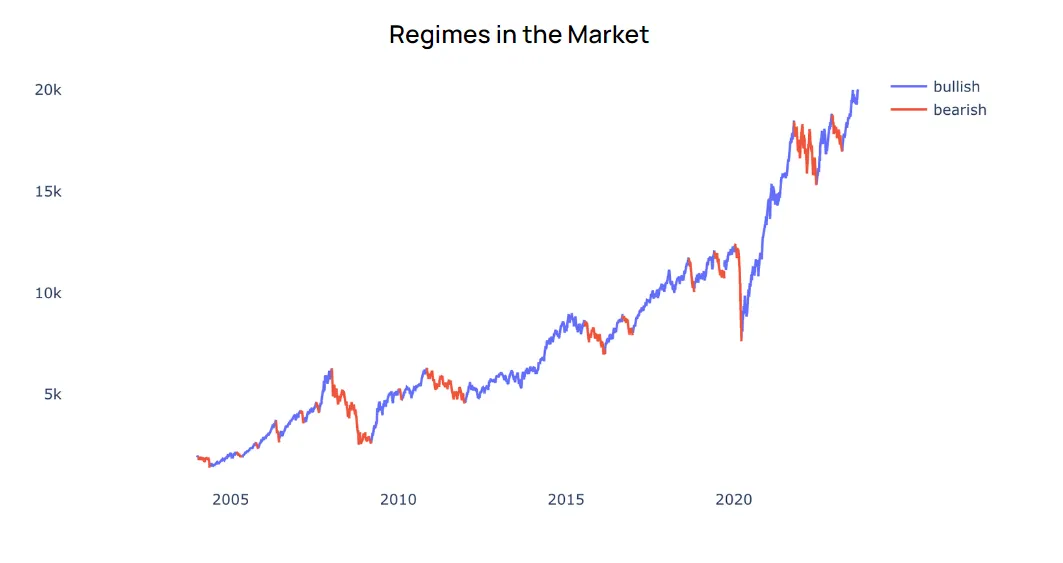
We should expect small-cap stocks to have had their most significant gains during the extended bullish periods, given their higher sensitivity to market upswings as shown in the returns during positive Nifty years. Conversely, during the bearish phases, smallcap stocks should likely face steeper declines, aligning with the greater losses observed in negative Nifty years.
Regarding volatility, it can be deduced that the market's bullish phases included periods of both high and low volatility. In times of high volatility, as indicated by the returns in years with high volatility, small-caps again would have seen pronounced gains due to their higher beta, which measures sensitivity to market movements. Large-caps, while still benefiting from the bullish market, would have seen less pronounced swings in line with their more stable nature.
What happens in different market regimes for small cap, mid cap and large cap stocks?
In bullish regimes, small-cap stocks have the highest returns at 0.22%, closely followed by mid-caps at 0.21%, and large-caps at 0.18%. This is consistent with the earlier images showing small-caps outperforming other segments in positive market years, likely due to their greater sensitivity to market recoveries and growth prospects.
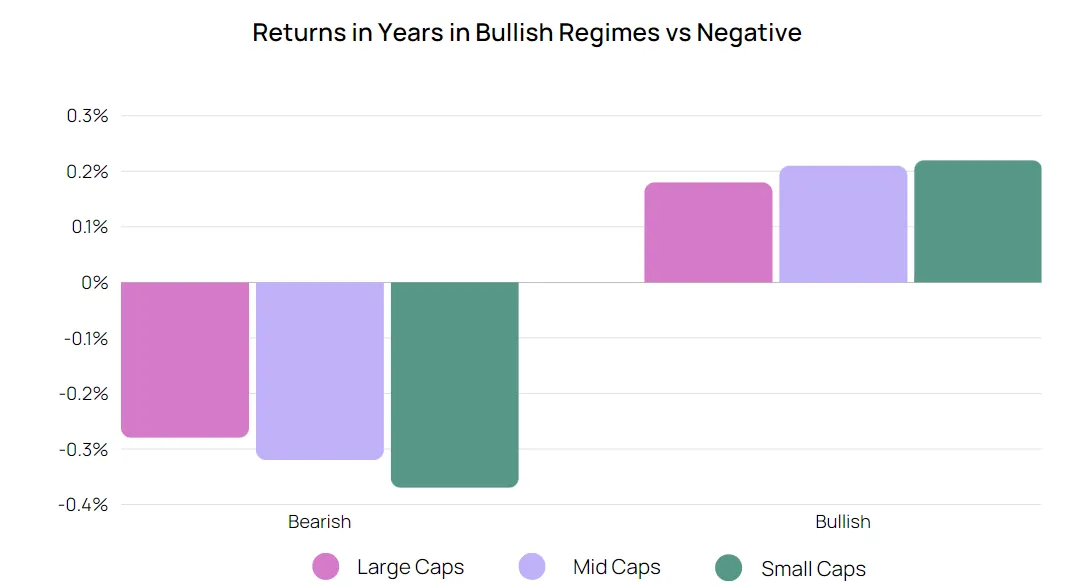
In bearish regimes, all segments see negative returns, with small-caps experiencing the largest decline at -0.37%, then mid-caps at -0.32%, and large-caps at -0.28%. This decline is smaller than the losses suggested in the earlier images during years with negative Nifty returns, possibly indicating that bearish regimes may include both flat and declining markets, and not all bearish periods are equally detrimental. Small-caps not only perform best during bullish markets but also are most affected by high volatility, emphasizing their risk-reward nature. Meanwhile, large-caps, with their modest returns in both bullish and bearish regimes, confirm their role as a stabilizing force in a portfolio, less affected by market fluctuations and providing a buffer during volatile or declining markets.
Diversification Ratio Across Different Market Regimes
In different market regimes, diversification ratios should be calibrated to the prevailing economic landscape. The data implies that small-caps, which excel in bullish periods, should command a larger share of the portfolio when market indicators point to growth. In contrast, bearish phases necessitate a higher allocation towards large-caps to mitigate the risk of significant declines. Investors should dynamically adjust their diversification ratios, reducing exposure to small-caps as markets peak and incrementally shifting towards large-caps as bearish signals emerge. While small-caps can offer the highest returns during market upswings, they also bear the brunt during downturns, and thus, a balanced approach that includes large-caps could be prudent for risk management.
Get research like this in your inbox
The week’s research that mattered, in five minutes. Joined by 2L+ investors.
How FII & DII flow impacts returns across different market caps?
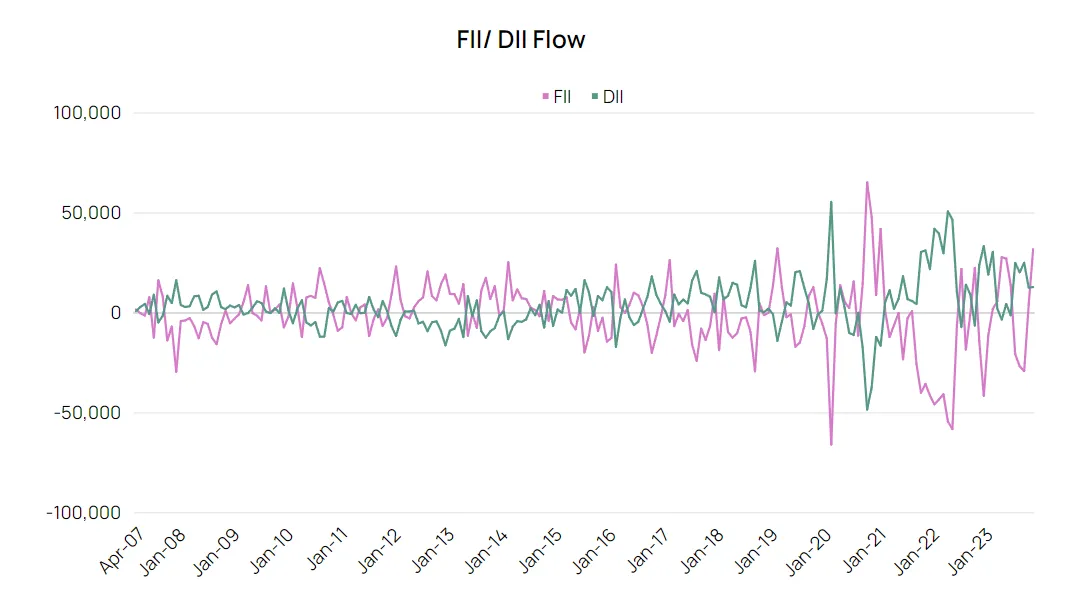
Let’s look at Foreign Institutional Investors (FII) and Domestic Institutional Investors (DII) flows with market returns across large, mid, and small-cap stocks. Notably, there are periods where DII investments seem to counterbalance FII outflows, which could indicate a stabilizing effect DIIs have on the market, possibly cushioning against foreign capital flight.
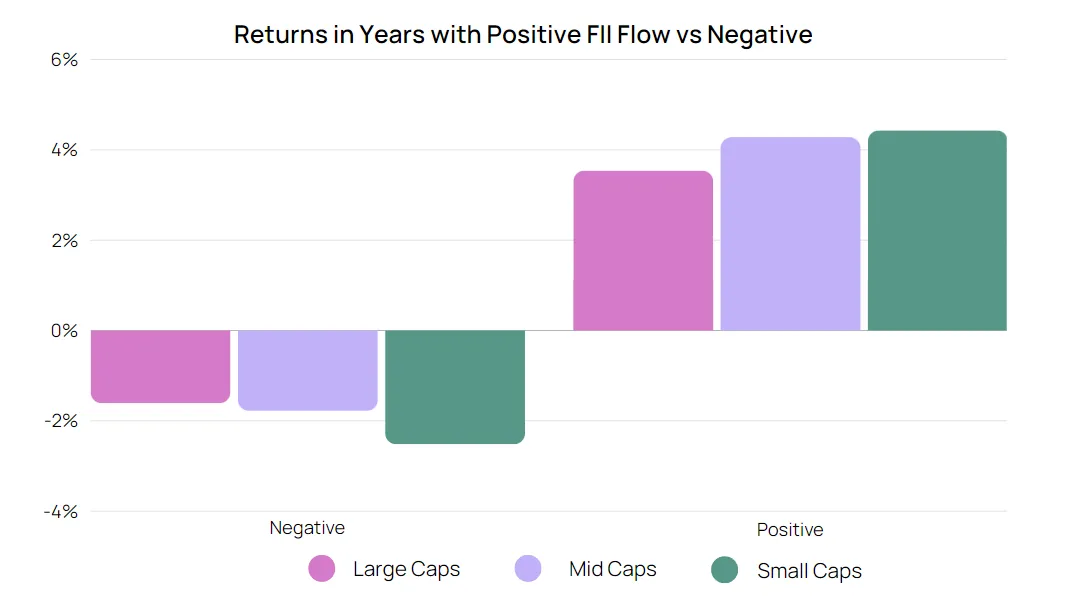
Here we can see that in years with positive FII flow, small-cap stocks lead with returns of 4.43%, followed by mid-caps at 4.28% and large-caps at 3.54%. Negative FII flows see all categories in decline, with small-caps again most affected at -2.52%. This suggests that FIIs have a significant impact on market performance, especially on the more volatile small-cap segment.
During years with positive DII flow, the returns across all market caps are less differentiated than with FII flows, with small-caps at 4.88%, mid-caps at 4.56%, and large-caps at 3.98%. Negative DII flows inversely affect the segments less drastically, with small-caps at -1.21%, indicating a possible lower reliance on domestic institutional investment for market buoyancy.
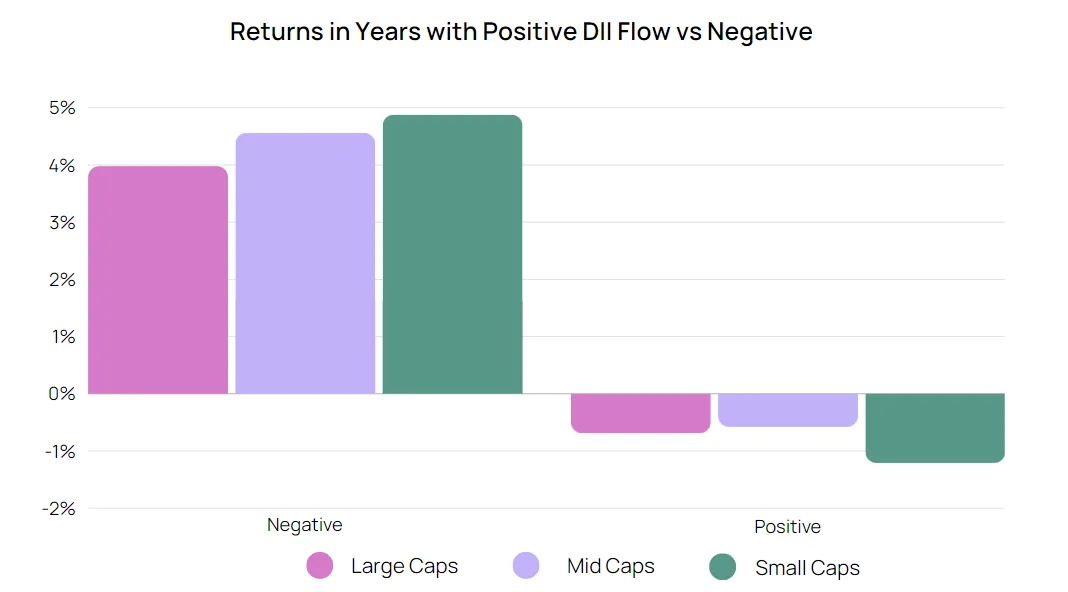
It is apparent that FIIs might have a pronounced influence on market sentiments, amplifying returns, especially in small-cap stocks during bullish and high-volatility environments. Meanwhile, DIIs appear to provide a steadier investment stream, offering support across all market caps, but with a lesser impact on returns than FIIs. FIIs may drive higher highs and lower lows, particularly in more speculative small-cap stocks, while DIIs seem to contribute to a more balanced market, with their impact more evenly spread across large, mid, and small-cap stocks.
What does your diversification ratio need to be across different market regimes?
A portfolio's diversification ratio should be strategically tailored to capture growth in bullish markets while mitigating risk in bearish or volatile conditions. This means an investor might allocate a larger proportion to small-caps during market upswings to maximize returns but would increase their large-cap holdings when signs point to an impending downturn or during periods of high market volatility. This balanced approach aims to stabilize the portfolio's performance, smoothing out the peaks and troughs that come with market cycles.
Moreover, the impact of FII and DII flows on different market caps cannot be overlooked. FIIs often chase high-growth opportunities, which can significantly affect small-cap valuations, while DIIs provide a more stable investment base, potentially offsetting FII volatility. The diversification ratio should, therefore, also consider the current and projected trends in FII and DII flows, adjusting the portfolio to either seize the momentary growth or shield against potential outflows.
Impact of diversification across market caps
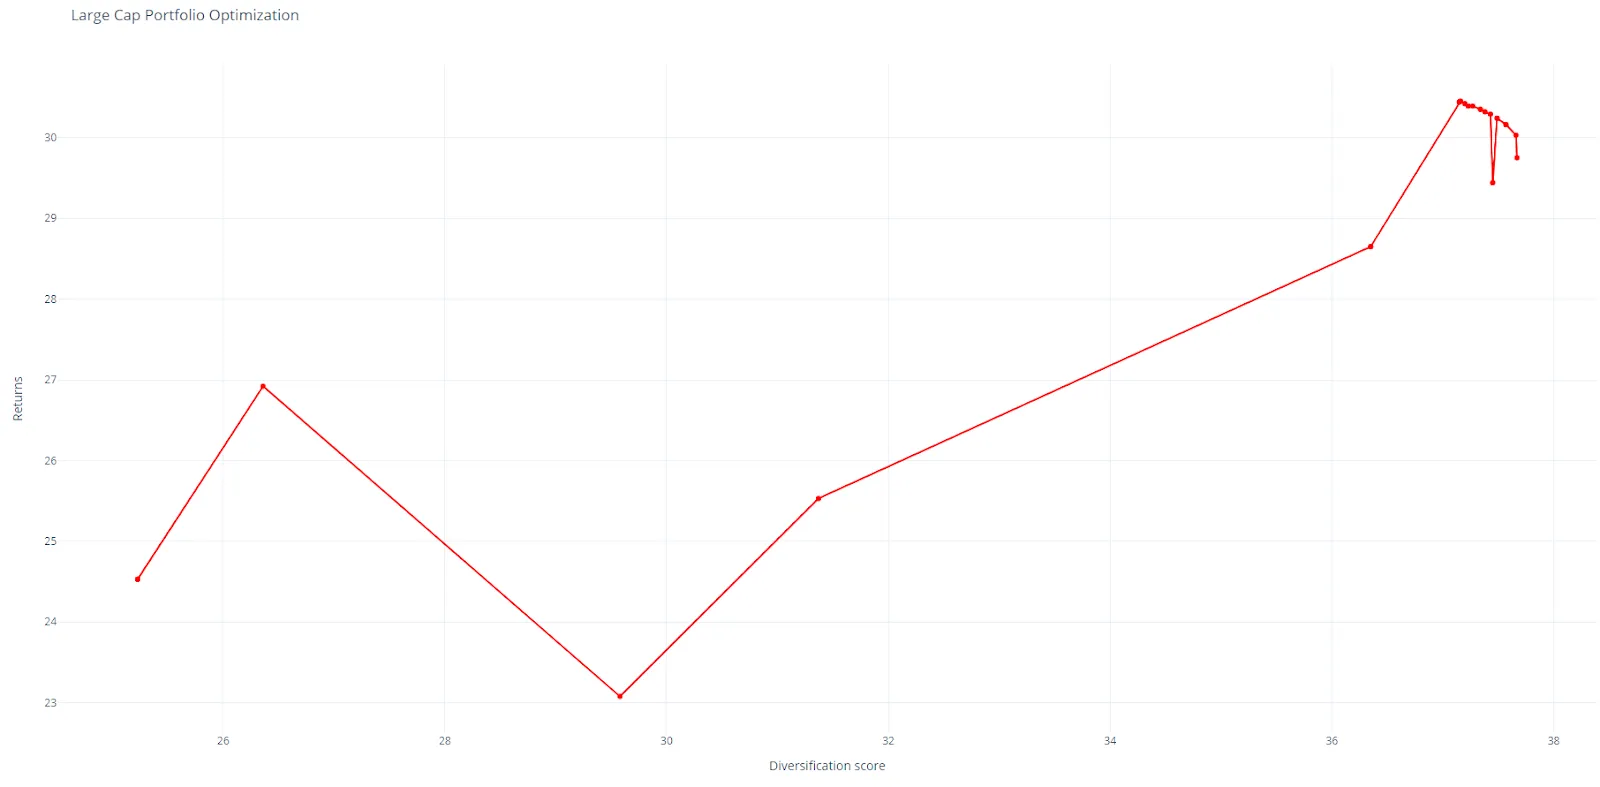
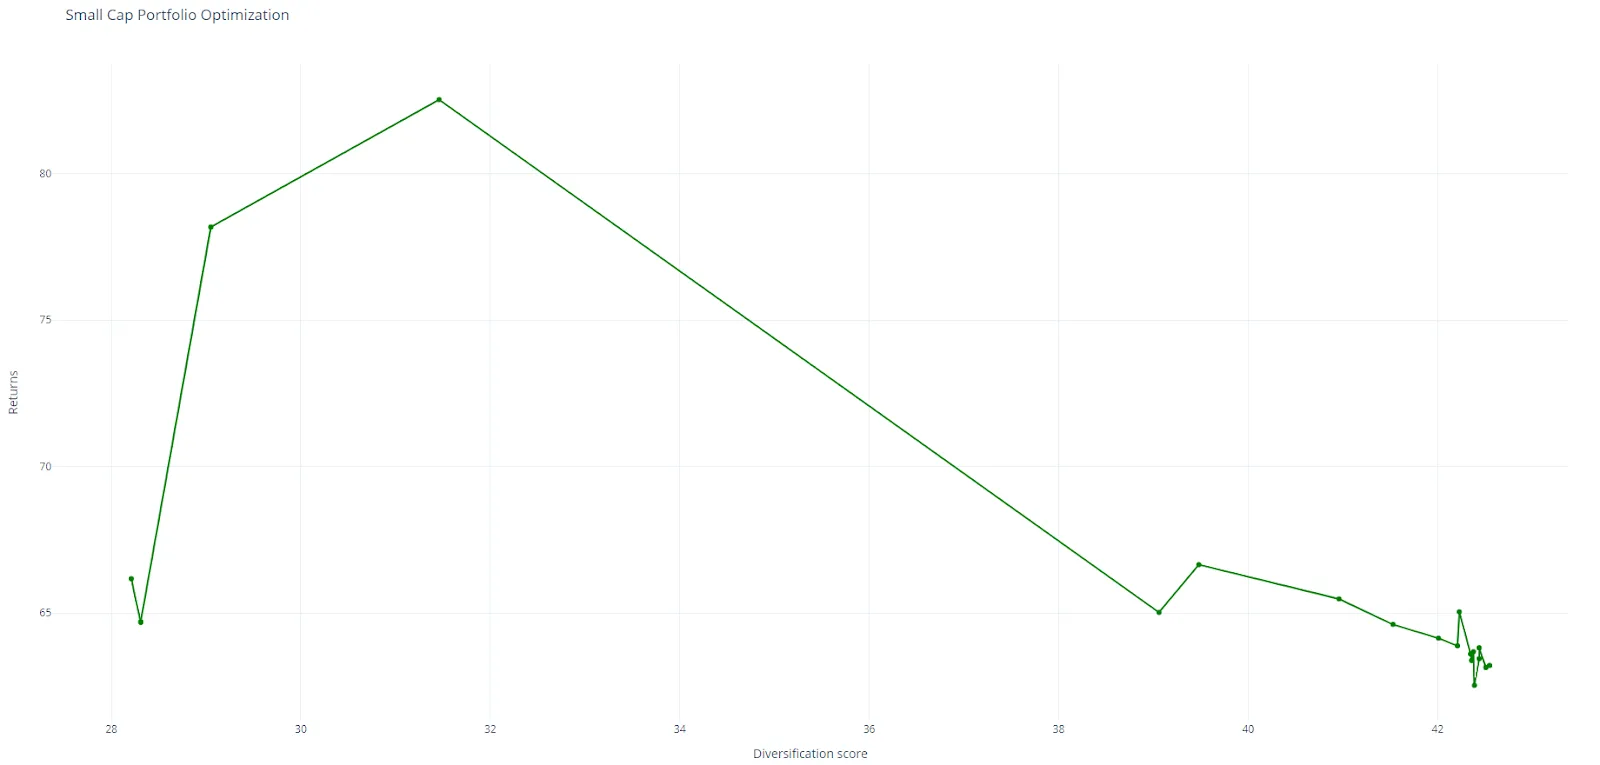
Wright Research team did a graphical analysis of portfolio optimization across small, mid, and large-cap stocks which offers a quantitative backdrop to the qualitative strategies we have discussed above. The large-cap optimization graph shows a more gradual ascent in returns as the diversification score increases, highlighting their role in providing stability and steady growth within a portfolio. The resemblance of this curve to the modest growth rates of large-caps underscores their value in risk mitigation during turbulent market phases.
Interested in exploring large cap stocks? Find the Best Large Cap Stocks to Buy Today.
Deep dive in the large cap sector and analyze top performing companies in our detailed sector analysis tool for Best Large Cap Stocks in India.
The mid-cap optimization graph exhibits a dramatic fluctuation in returns, which may reflect the unique position of mid-caps straddling the boundary between the growth potential of small-caps and the stability of large-caps. This visual suggests that mid-caps can offer a balance of growth and stability, depending on the market regime, supporting our earlier suggestion that they benefit from market fluctuations to a considerable degree. 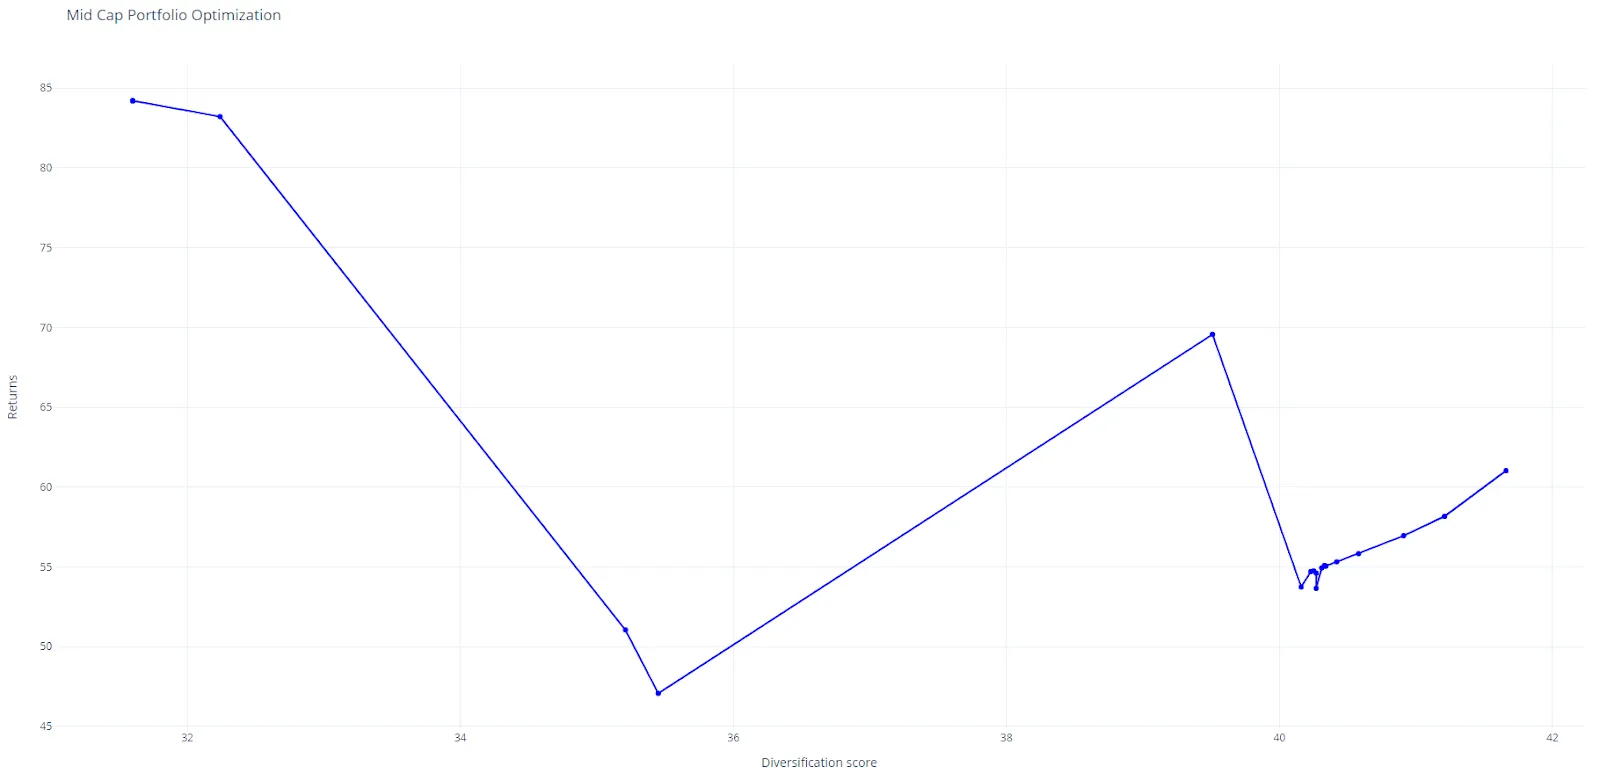
Read this article to find the Best midcap stocks to invest in 2023: Top Picks
Deep dive in the mid cap sector and analyze top performing companies in our detailed sector analysis tool for Best Mid Cap Stocks in India.
For small-cap investments, the optimization graph presents a peak, suggesting an optimal diversification score where returns are maximized before they start to decline. This peak aligns with the high returns seen during positive Nifty years, reinforcing our earlier point that small-caps, while volatile, can significantly enhance portfolio performance in favorable market conditions.
Read this article to find the Best Small Cap Stocks: Top Investment Picks
Deep dive in the small cap sector and analyze top performing companies in our detailed sector analysis tool for Best Small Cap Stocks in India.
An effective portfolio management strategy in the Indian equity market requires an agile diversification strategy, one that is responsive to both market cap performance and the broader financial ecosystem's influence. It's not just about balancing different types of stocks but also about fine-tuning the portfolio to the market's pulse — capturing the growth of small and mid-caps when the market is ripe for returns, and shifting towards the defensive nature of large-caps when preservation of capital becomes paramount.
Run the numbers on your next investment
Project returns on a lumpsum or SIP with our free calculators.
Video: Large caps vs Mid caps vs Small caps - What is in your portfolio?
Continuing the analysis - we look at large caps vs mid caps vs small caps and their impact on your investment returns across different market cycles and in different market regimes.
Key Takeaways:
👉Understand the risk-reward trade-offs between different market caps.
👉Learn how to adjust your portfolio in response to market volatility and regimes.
👉 Discover how FII & DII flows can influence your investment strategy.
👉Impact of diversification across market caps
Watch the video to learn more! 👇🏻
Join our Telegram Channel to get daily morning market updates. Subscribe to our Youtube Channel to learn about all things investing, understand sector performance, get key insights into new topics like concentrated portfolio, quantitative investing and more!
Other interesting articles to explore:
- Stock Market Predictions For 2024
- 2023 Recap: Indian Stock Market Performance, Indian Economy & Wright Portfolios Performance in 2023
- Buying Stocks in October, November & December? Seasonal Patterns in Global & Indian Stock Markets
- Four Years of Wright Momentum: Mastering the Art of Building a Successful Momentum Strategy


