


Learning stock valuation means estimating what a business is worth and then translating that estimate into value per share. It is not about finding one perfect formula. It is about connecting business economics, financial statements, future cash flows and risk.
Beginners should use several stock valuation methods as cross-checks. A discounted cash flow model estimates value from expected cash generation, while market multiples compare the company with similar businesses. Both require judgement, and both work better when the underlying accounts are understood.
Valuation starts with the business and its accounts, not a share-price target.
How to Value a Stock: A Practical Framework
A practical answer to how to value a stock has six stages: understand the business, examine the statements, normalise the numbers, choose a model, test assumptions and compare estimated value with price. Treat the output as a range because small changes in growth or discount rates can materially change value.
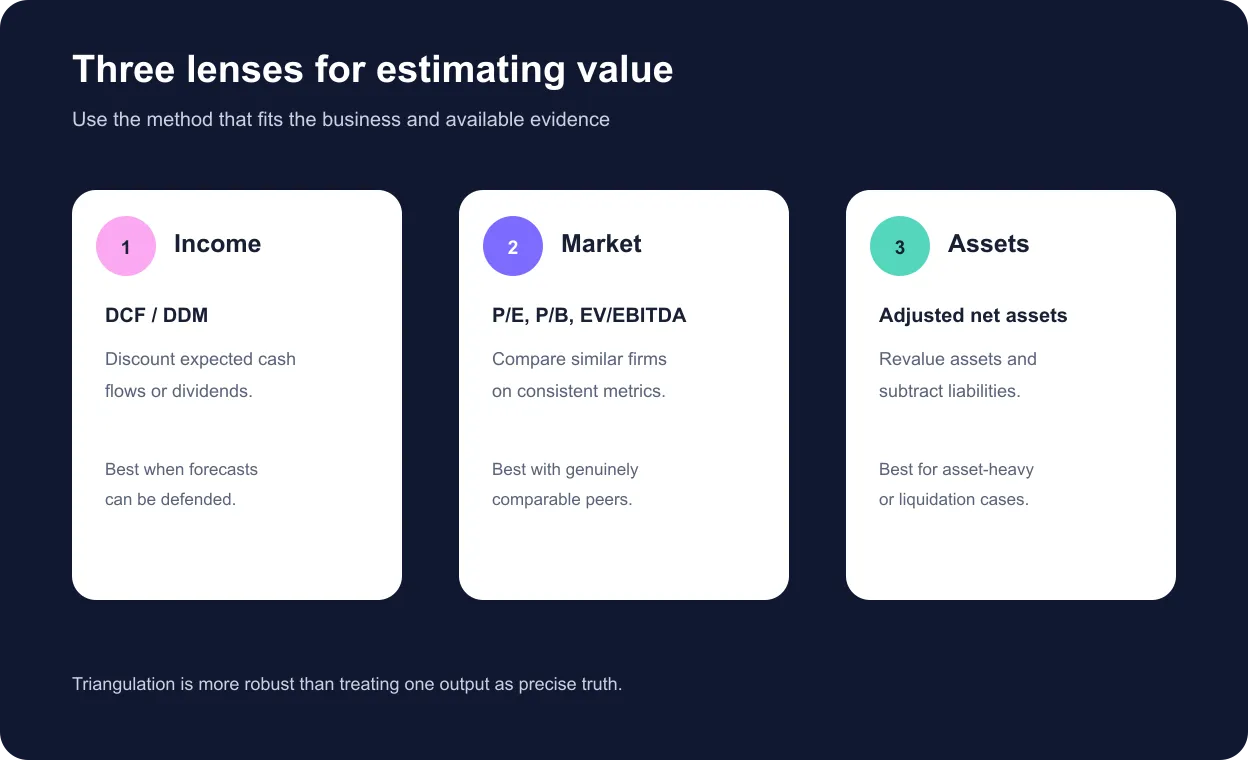
The main stock valuation methods fall into three families. Income approaches such as DCF value expected cash flows. Market approaches use multiples such as P/E or EV/EBITDA. Asset approaches estimate assets less liabilities, often after adjustments. The right choice depends on business maturity, capital intensity, profitability and data quality.
When deciding how to value a company , define whether the model values equity directly or the entire enterprise. Equity value belongs to shareholders. Enterprise value belongs to all capital providers; net debt and other claims must be deducted before dividing by diluted shares.
See what markets are pricing in
Live indices, sector moves and market breadth — the backdrop to every story we publish.
Start With the Business, Not the Share Price
Before opening a spreadsheet, explain how the company earns money. Identify customers, pricing, volumes, costs, reinvestment needs, competitive advantages and major risks. A valuation built on unexplained growth is only arithmetic.
Ask what drives revenue, whether margins are cyclical, how much capital supports expansion and whether growth earns more than the cost of capital. The intrinsic value of stock rises when a company can reinvest at attractive returns for longer, not simply when reported revenue grows.
Understanding how to value a company also requires mapping its industry. Regulation, commodity prices, technology, customer concentration and bargaining power can change sustainable margins. Build a base case that reflects normal economics, plus downside and upside cases that expose the assumptions carrying the valuation.
Break the business into measurable drivers. For a retailer, these may be store count, sales per store and gross margin. For software, they may be customers, retention, pricing and service costs. Check whether reported growth requires heavy marketing, working capital or new fixed assets. Growth creates value only when the return on incremental investment exceeds the return investors require. Management's record on acquisitions, dividends, buybacks and debt also affects how much operating success reaches each shareholder.
Read the Financial Statements
The income statement shows revenue, expenses and profit over a period. The balance sheet shows assets, liabilities and equity at a date. The cash-flow statement reconciles profit with cash from operations, investing and financing. Read them together because earnings can rise while cash conversion deteriorates.
Normalise one-off gains, restructuring charges and unusually low or high margins. Review working-capital movements, capital expenditure, lease obligations, debt, cash, dilution and contingent liabilities. For banks and insurers, deposits, credit quality, capital adequacy and book value matter more than industrial-company free cash flow.
To learn how to value a stock, calculate a small operating history: revenue growth, operating margin, tax rate, return on capital, cash conversion and leverage. Use notes to accounts to understand accounting policies. Historical patterns do not dictate the future, but they constrain credible assumptions.
Test earnings quality before forecasting. Compare cumulative operating cash flow with cumulative profit, investigate persistent receivable or inventory growth, and separate maintenance investment from expansion where disclosures permit. Review auditor qualifications, related-party transactions, capitalised expenses and changes in depreciation policy. A business can report growing earnings while issuing shares, borrowing heavily or consuming cash. Use diluted shares, include employee options where material and reconcile management's adjusted metrics with audited numbers.
Key Relative Valuation Ratios: P/E, P/B and EV/EBITDA
Price-to-earnings equals market price per share divided by earnings per share, or market capitalisation divided by total earnings. P/E is intuitive for profitable firms, but it can mislead when earnings are cyclical, temporarily depressed or distorted by non-recurring items.
Price-to-book compares market capitalisation with accounting equity. It can be informative for financial companies where assets and liabilities are regularly marked or closely linked to earnings capacity. For asset-light firms, old accounting book values may omit internally created brands, software and network effects.
Enterprise value to EBITDA compares the value of operating assets with a pre-interest, pre-tax and pre-depreciation measure. An EV EBITDA valuation supports comparisons across different capital structures, but EBITDA is not cash flow because it ignores capital expenditure, working capital and taxes.
| Multiple | Useful for | Main caution |
|---|---|---|
| P/E | Profitable companies with reasonably stable earnings | Debt, cycles and accounting items affect earnings |
| P/B | Banks, insurers and asset-based businesses | Book value may not represent economic asset value |
| EV/EBITDA | Operating comparison across capital structures | Ignores reinvestment and working-capital needs |
| EV/Sales | Early-stage or temporarily loss-making companies | Revenue without a path to margins has limited meaning |
Comparable firms should share business mix, growth, margins, risk, geography and accounting. A low multiple can signal opportunity or weak economics. Among stock valuation methods, relative analysis is fastest, but its conclusion is only as good as the peer set and denominator.
Use the same measurement period for every peer. Trailing multiples rely on reported history; forward multiples rely on forecasts and introduce estimation risk. For cyclical businesses, compare mid-cycle earnings rather than a single boom or recession year. Also explain why a premium or discount may be justified. Higher returns on capital, lower leverage or more durable growth can support a premium, while concentration, governance concerns or poor cash conversion may support a discount.
DCF Valuation Explained for Beginners
DCF valuation estimates value as the present value of expected future cash flows. A firm model discounts free cash flow to the firm at the weighted average cost of capital, producing enterprise value. An equity model discounts free cash flow to equity at the cost of equity.
The core rule is consistency: match the cash flow with the correct discount rate. Forecast revenue, operating margin, taxes, reinvestment and working capital for an explicit period. Then calculate terminal value for cash flows beyond that period. In a perpetual-growth model, terminal value at year n is next year’s cash flow divided by discount rate minus stable growth.
A credible DCF valuation keeps perpetual growth below the discount rate and consistent with a mature company. NYU Stern valuation material also cautions that a stable company cannot outgrow its economy forever. Terminal value often represents a large share of enterprise value, so it deserves more scrutiny than a decorative final cell.
Estimate the discount rate in the same currency and inflation terms as the forecast. The cost of equity should reflect business and financial risk; WACC also includes the after-tax cost of debt and market-value capital weights. Do not lower the discount rate merely to offset conservative cash flows. Instead, keep operating forecasts and risk assumptions separately defensible, then show how the result changes across a reasonable range.
The hypothetical example below forecasts free cash flow of ₹100, ₹110, ₹120, ₹130 and ₹140 crore. At a 10% WACC and 4% perpetual growth, the present value of explicit cash flows is about ₹448 crore and terminal value about ₹1,507 crore. Enterprise value is approximately ₹1,955 crore.
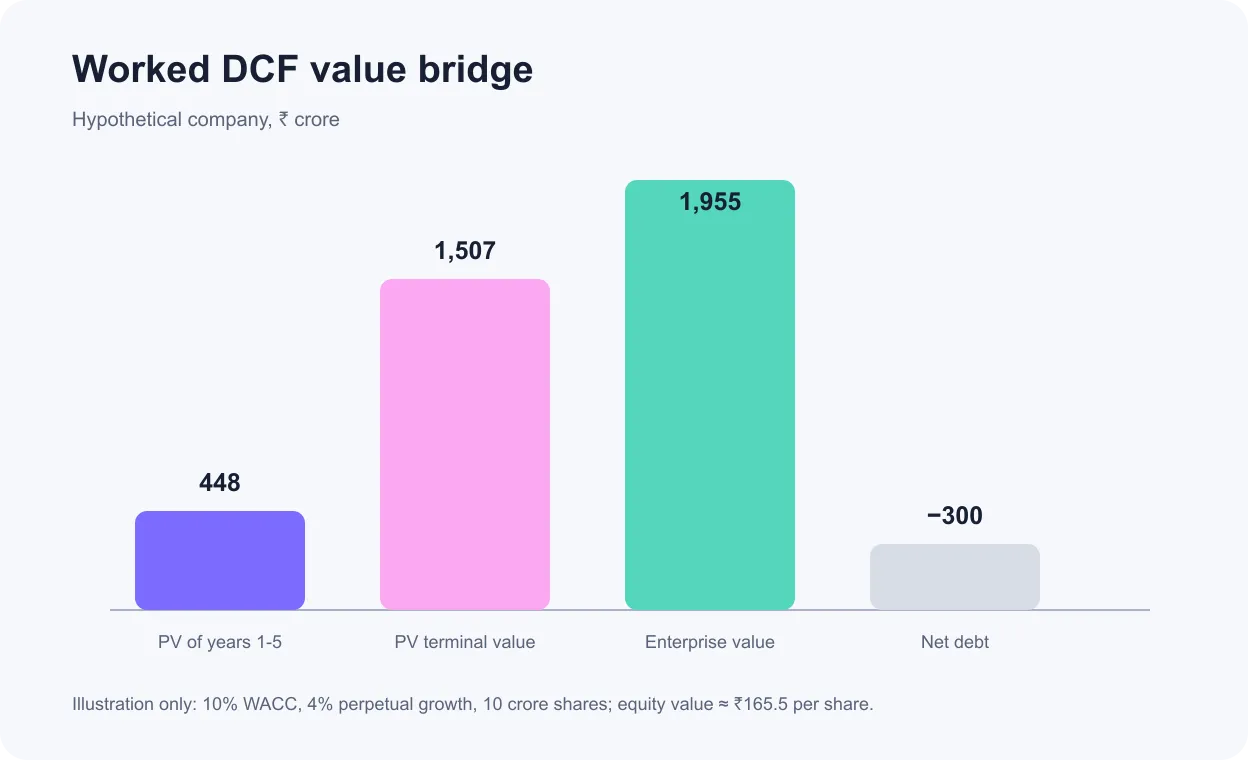
After subtracting ₹300 crore of net debt, hypothetical equity value is about ₹1,655 crore. With 10 crore diluted shares, estimated value is roughly ₹165.5 per share. This worked model is an illustration, not a view on any listed company.
Get research like this in your inbox
The week’s research that mattered, in five minutes. Joined by 2L+ investors.
How to Estimate Fair Value
Fair value should be a range, not a single decimal. Start with base, downside and upside assumptions for revenue growth, margins, reinvestment, discount rate and terminal growth. Record why each assumption is reasonable and which evidence would change it.
When learning how to value a stock, avoid deriving the desired answer from the current price. Estimate operating performance first. Run sensitivity tables around the uncertain variables, particularly WACC and terminal growth in a DCF valuation. If a small change destroys the investment case, confidence should be low.
Cross-check the result with other stock valuation methods. Compare implied P/E, EV/EBITDA and free-cash-flow yield with history and peers. If the DCF implies a multiple far outside the sector, investigate whether forecasts, accounting normalisation, capital needs or peer selection explain the difference.
A reverse DCF can provide another check. Instead of forecasting value, begin with the market price and solve for the growth or margin needed to justify it. Compare those implied expectations with the company's history, industry capacity and competitive position. This does not prove the price is right or wrong, but it makes the debate concrete and reveals whether the market is assuming an unusually optimistic or pessimistic future.
Keep a valuation log with the source and date for every material input. Separate reported facts from estimates, and note whether each forecast is nominal or real, consolidated or standalone. When results arrive, compare actual performance with the original assumptions before revising the model. This turns valuation into a repeatable analytical learning process.
Compare Intrinsic Value With Market Price
The fair value vs market price comparison separates analysis from trading. Market price is observable now. Fair or intrinsic value is an estimate based on assumptions. A stock can remain above or below an analyst’s estimate for a long time, and the estimate itself can be wrong.
The intrinsic value of stock should therefore be expressed with uncertainty. A margin of safety means requiring a meaningful gap between conservative value and price to absorb forecasting errors, business setbacks and market volatility. It does not guarantee against loss.
Review fair value vs market price after results, capital allocation, regulation or competitive conditions change. Do not alter assumptions merely because price moved. Knowing how to value a company includes identifying what new evidence genuinely changes long-run cash flow or risk.
Sector-Specific Valuation Considerations
No multiple works everywhere. Banks are commonly assessed through P/B, return on equity, asset quality and capital. Insurers may require embedded value and new-business metrics. Commodity producers need mid-cycle prices rather than peak earnings. Real estate can require net asset value.
For loss-making technology companies, revenue multiples need a credible route to margins and cash flow. Infrastructure and utilities require careful debt and regulatory assumptions. An EV EBITDA valuation may help compare industrial businesses, but lease treatment, maintenance capital expenditure and pensions must be consistent.
This is why company valuation begins with economics. The same reported earnings can deserve different multiples when growth durability, reinvestment, leverage and risk differ. Sector conventions are starting points, not substitutes for analysis. A careful estimate of the intrinsic value of stock must reflect those sector economics.
Common Stock Valuation Mistakes
Common errors include extrapolating recent growth indefinitely, using peak margins, ignoring dilution, comparing unlike peers and treating EBITDA as cash. Another is mixing enterprise cash flows with an equity discount rate, which produces an internally inconsistent model.
Do not confuse precision with accuracy. The intrinsic value of stock can change materially when a few assumptions move. Avoid double-counting cash, omitting debt-like liabilities or using basic shares when options and convertibles dilute ownership. Reconcile enterprise value to equity value visibly.
Finally, do not choose a method solely because it gives the highest number. A robust process explains how to value a stock, documents uncertainty, tests scenarios and states what would invalidate the thesis. The intrinsic value of stock is a decision aid, not a promise.
Is your portfolio built for what’s coming?
Get a free AI-powered review of your holdings — risk, overlap and quality in minutes.
FAQ
How do you value a stock?
Study the business and financial statements, normalise earnings or cash flow, choose a suitable valuation method, make explicit growth and risk assumptions, calculate a range, and compare that range with the market price.
What is intrinsic value?
Intrinsic value is an estimate of what a security is fundamentally worth based on expected future cash flows, growth and risk. It is an analytical estimate, not an observable fact or guaranteed price.
Which stock valuation method is best for beginners?
Relative multiples are easier to begin with, while a simple DCF teaches the relationship between cash flow, growth and risk. Using both as cross-checks is usually more informative than relying on one method.
How does DCF valuation work?
DCF forecasts future free cash flows and discounts them to the present using a rate reflecting risk. A terminal value captures cash flows beyond the explicit forecast period.
What do P/E and P/B ratios tell investors?
P/E shows the price paid per unit of earnings, while P/B compares market value with accounting book value. Both need peer, sector, profitability and accounting context.
How do you know if a stock is overvalued or undervalued?
Compare market price with a defensible valuation range and test alternative assumptions. A gap may indicate mispricing, but it may also reflect risks or information omitted from the model.


