


Quality and value are two of the most widely used equity factors, yet they reward different kinds of patience. Quality looks for durable economics. Value looks for a price that appears low relative to fundamentals. Market cycles decide which attribute investors reward more strongly at a given time.
The central question in quality vs value investing is not which label is permanently superior. It is whether the portfolio’s exposures, valuation and risks match the investor’s horizon and the economic conditions being faced.
Quality Investing and Value Investing: The Basics
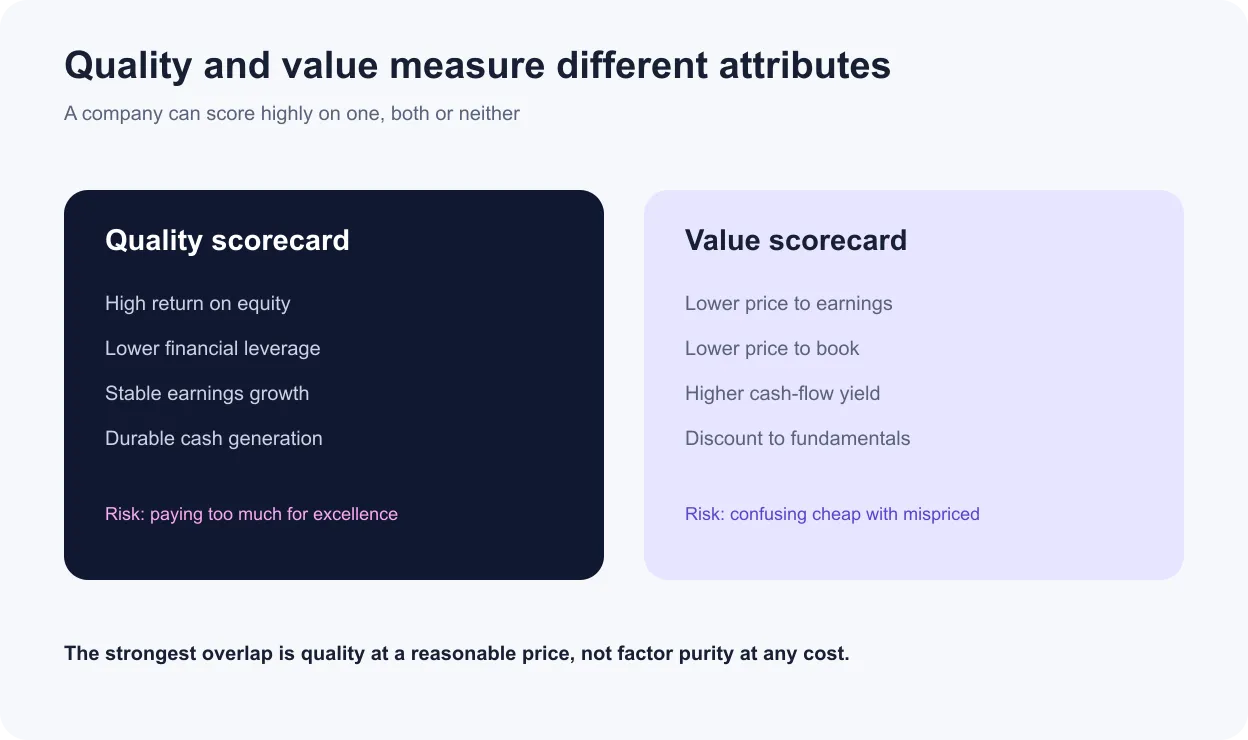
quality investing targets companies with strong profitability, prudent leverage and reliable earnings. value investing targets stocks that appear inexpensive relative to earnings, book value, sales, cash flow or estimated intrinsic value.
Both can be discretionary or rules-based. In systematic portfolios, factor definitions must specify the universe, signals, normalisation, weighting, rebalance schedule and constraints. Two strategies with the same factor label can therefore produce different holdings and outcomes.
quality vs value investing also differs in the source of expected return. Quality investors expect resilient businesses to compound. Value investors expect pessimism or temporary mispricing to reverse. Both can fail when the initial price already discounts the thesis.
See what markets are pricing in
Live indices, sector moves and market breadth — the backdrop to every story we publish.
What Makes a Stock a 'Quality' Stock?
There is no single universal quality formula. NSE’s Nifty200 Quality 30 selects from the Nifty 200 using return on equity, debt-to-equity and variability in EPS growth over the preceding five years. Higher profitability, lower leverage and more stable earnings receive better scores.
Broader quality factor investing models may also consider return on invested capital, gross profitability, accruals, cash conversion and balance-sheet strength. Financial companies need different leverage interpretation because borrowing is part of their operating model.
A quality company is not automatically a good purchase. Premium multiples can compress when interest rates rise, growth slows or expectations become excessive. The biggest risk in quality investing is often not business failure but overpaying for durability.
What Makes a Stock a 'Value' Stock?
Value starts with price relative to a fundamental measure. Common signals include P/E, P/B, EV/EBITDA, dividend yield and free-cash-flow yield. Systematic value factor investing usually combines more than one metric to reduce dependence on accounting quirks.
Cheapness needs context. A low P/E can reflect peak cyclical profits. A low P/B bank can carry weak asset quality. A high dividend yield may precede a cut. Effective value investing separates temporary disappointment from permanent impairment.
Value portfolios often lean toward sectors where assets and current earnings are prominent, including financials, energy, materials and industrials. That sector composition helps explain why value vs quality stocks can react differently to growth, inflation and commodity cycles.
Quality vs Value: Key Differences
| Dimension | Quality | Value |
|---|---|---|
| Primary question | How strong and consistent is the business? | How inexpensive is the stock relative to fundamentals? |
| Common signals | ROE, leverage, earnings stability, cash conversion | P/E, P/B, EV/EBITDA, cash-flow yield |
| Typical risk | Valuation compression | Value traps and prolonged neglect |
| Common sector tilt | Consumer, technology, healthcare; methodology-dependent | Financials, energy, materials, industrials; methodology-dependent |
| Behavioural challenge | Paying any price for a good company | Buying cheap without a catalyst or quality check |
The quality vs value stocks comparison is not simply expensive versus cheap. Quality measures operating and financial characteristics; value measures market price relative to fundamentals. A company can rank well on both.
quality vs value investing portfolios also differ because the eligible universe and construction rules differ. Comparing Nifty200 Quality 30 with Nifty500 Value 50 mixes factor, universe and constituent-count effects. Any performance conclusion should acknowledge all three.
Get research like this in your inbox
The week’s research that mattered, in five minutes. Joined by 2L+ investors.
How Each Factor Performs in Bull and Bear Cycles
Quality is often described as defensive because profitable, conservatively financed companies may sustain earnings better during stress. MSCI’s long-run research has characterised quality as more defensive and value as more cyclical, but these are historical tendencies rather than forecasts.
Value can lead in early recoveries when depressed expectations improve, yield curves steepen or economically sensitive sectors rebound. It may also benefit during commodity upswings through sector exposure. Yet cheap firms with excessive leverage can remain vulnerable in a recession.
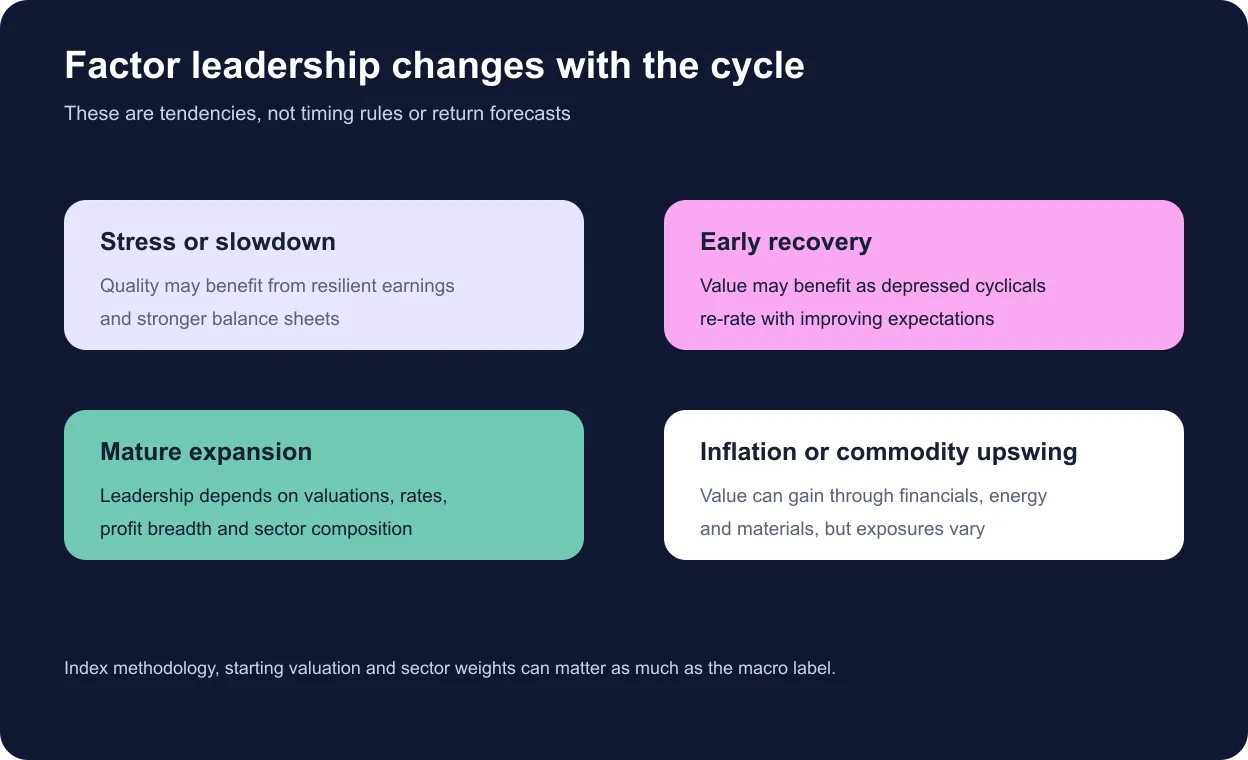
In strong momentum-led bull markets, either factor can lag if leadership sits elsewhere. In rising-rate periods, richly priced quality stocks can face multiple compression, while some value sectors may benefit. The outcome for quality vs value stocks is never determined by one macro variable.
A robust quality vs value investing analysis therefore examines earnings revisions, valuation spreads, sector weights, leverage and liquidity alongside the business-cycle narrative.
Historical Performance: Quality vs Value in India
NSE Indices’ factor research demonstrates cyclicality rather than a permanent winner. Its historical multi-factor paper observed that quality outperformed during economic recoveries in 2009 and 2012, while value performed strongly in the 2009 recovery and during commodity rallies including 2007, 2010 and 2016.
The same research noted that quality’s 2016 weakness was connected to large IT and pharmaceutical exposure. This is an important lesson: index history reflects sector concentration and methodology, not a pure laboratory factor.
Current NSE methodology selects Nifty200 Quality 30 constituents using ROE, debt-to-equity and earnings variability, while Nifty500 Value 50 uses a broader universe and value criteria. Both rebalance semi-annually. These design differences affect turnover, liquidity, market-cap exposure and performance.
When comparing value vs quality stocks , use total-return indices, identical dates and rolling periods. Separate live history from backtests and account for implementation costs. One calendar-year table cannot establish a durable factor premium.
The evidence supports diversification and discipline, not cycle-chasing. Historical quality vs value investing leadership can reverse after valuation spreads become extreme or sector earnings change.
Can You Combine Quality and Value Investing?
Yes. Investors can screen for inexpensive stocks and then exclude weak balance sheets, unstable earnings or poor cash conversion. Alternatively, they can begin with high-quality companies and require a reasonable price before entry.
A composite score is another route. Rank securities on standardised quality and value measures, combine the scores, then apply liquidity and concentration controls. quality factor investing can reduce value traps, while value factor investing can limit overpayment.
Combination design matters. A strict intersection may produce too few stocks and unintended sector bets. A blended rank offers breadth but can admit a stock that is strong on one factor and weak on the other. Investors should know which compromise the portfolio uses.
Rebalancing also creates turnover and tax consequences. Factor scores change with prices and financial statements, so buffers and staggered reviews can prevent unnecessary trading. Wright Research’s factor-based portfolio illustrates how multiple signals can be brought into one systematic framework.
When to Consider Quality vs Value Investing
Consider quality investing when the objective emphasises resilient profitability, balance-sheet strength and lower fundamental uncertainty. It may suit investors willing to accept that strong businesses can underperform when their valuations compress.
Consider value investing when the investor can tolerate long periods of weak sentiment and distinguish recovery potential from structural decline. A value allocation requires patience and comfort with cyclical or unfashionable sectors.
For quality vs value investing , the decision should begin with existing portfolio exposure. A market-cap index may already contain profitable mega-cap companies; adding quality can deepen that tilt. Value can diversify it, but may add financial, commodity or state-owned-enterprise exposure.
Do not use recent returns as the selection rule. Assess methodology, valuation spread, sector concentration, drawdowns, turnover, product costs and tracking difference. The value vs quality stocks choice should survive a full cycle, not depend on correctly calling the next quarter.
A blended allocation can reduce timing risk. Rebalance to strategic weights rather than switching entirely after one factor has already rallied. Investors can review how factor investing works before selecting a single-factor or multi-factor route.
Implementing a quality and value allocation
Start by measuring the portfolio you already own. Map each holding by profitability, leverage, earnings stability and valuation, then compare sector and market-cap weights with a broad benchmark. A portfolio labelled diversified can still carry a large hidden quality tilt through profitable mega-cap companies or a value tilt through banks and commodity businesses.
When combining strategies, decide whether each sleeve receives a fixed weight or whether weights can vary inside predetermined bands. Fixed weights are easier to govern and reduce the temptation to chase recent winners. Bands permit modest rebalancing but need explicit thresholds, review dates and rules for cash flows.
| Area | What to examine |
|---|---|
| Definition | Signals, look-back period, exclusions and financial-sector treatment |
| Construction | Eligible universe, stock caps, sector constraints and weighting method |
| Overlap | Shared holdings with broad index funds and other active strategies |
| Implementation | Expense ratio, turnover, liquidity, taxes and tracking difference |
| Governance | Rebalance schedule and conditions for changing the allocation |
Compare products with the benchmark their methodology is designed to beat, not whichever index produces the most flattering result. Total-return indices are preferable because they include dividends. Rolling three-, five- and seven-year periods reveal consistency better than a single start and end date.
Finally, write down the reason for owning each sleeve and the behaviour expected during difficult periods. If quality lags in a sharp cyclical rally or value suffers during a balance-sheet crisis, that outcome may be consistent with the design. A strategy should be reconsidered when its implementation or assumptions break, not merely when another factor leads temporarily.
Track the factors behind this research
Momentum, value, quality and low-vol — updated factor performance for Indian markets.
FAQ
What is factor investing?
Factor investing uses transparent characteristics such as quality, value, momentum or low volatility to select and weight securities systematically rather than relying only on market capitalisation.
What are quality stocks?
Quality stocks generally combine strong profitability, manageable leverage and stable earnings. The exact definition depends on the strategy or index methodology being used.
What is the difference between quality and value investing?
Quality focuses on business strength and consistency. Value focuses on a low price relative to earnings, book value, cash flow or other fundamentals.
When might quality or value investing be more suitable?
Quality may be useful when resilience and balance-sheet strength matter, while value may benefit when depressed expectations recover. Suitability still depends on horizon, valuation and portfolio risk.
What is value investing with example?
Value investing seeks securities priced below a reasonable estimate of worth. For example, a profitable bank trading below comparable peers may be a candidate only after asset quality, growth and governance are assessed.
Does quality investing outperform value investing long term?
Neither factor wins in every period. Results depend on starting valuations, methodology, sector weights and market cycle, so long-term evidence should be assessed across multiple regimes.
Can a stock be both a quality and value stock?
Yes. A financially strong company can trade at an attractive valuation after temporary concerns, creating an overlap sometimes described as quality at a reasonable price.
Neither quality factor investing nor value factor investing removes equity risk. Compare methodology and price before deciding between quality vs value stocks , and size the allocation for periods when the chosen factor is out of favour.


