


Valuation turns a business narrative into an estimate of what its equity may be worth. It does not predict tomorrow’s price. It forces an investor to connect revenue, margins, reinvestment, risk and capital structure to a range of defensible values.
The main stock valuation methods are discounted cash flow, dividend discount models and relative valuation. Each asks a different question, so disciplined analysts often triangulate rather than search for one perfect answer.
Why Stock Valuation Matters for Investors
A strong company is not automatically a good investment at every price. stock valuation connects business quality to the return implied by the price paid. It helps investors distinguish an excellent company from an attractively priced security.
Valuation also creates discipline. Instead of reacting to a target price, investors can identify which growth, margin and risk assumptions the market price appears to require. That comparison exposes when expectations leave little room for disappointment.
For Indian investors, stock valuation methods in India use the same economic principles as elsewhere but require local inputs: rupee risk-free rates, Indian equity risk, tax rules, sector structure, promoter holdings, related-party transactions and disclosure quality.
See what markets are pricing in
Live indices, sector moves and market breadth — the backdrop to every story we publish.
Absolute vs Relative Valuation: The Two Broad Approaches
Absolute stock valuation estimates intrinsic value from expected cash flows and risk. DCF and DDM fall in this group. Relative valuation asks how the market prices comparable businesses using a standardised denominator such as earnings, book value or EBITDA.
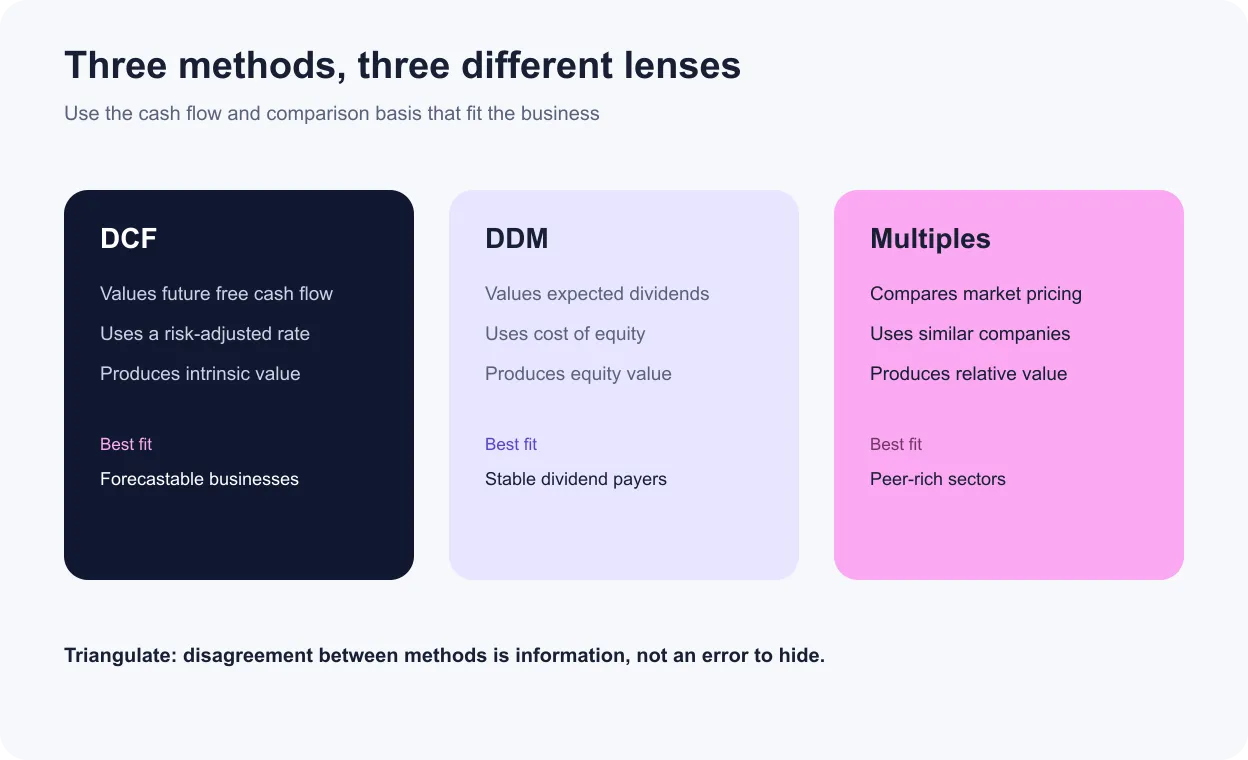
Neither approach is assumption-free. DCF makes forecasts visible. Multiples embed assumptions in peer selection, accounting definitions and market pricing. A sector can look internally cheap while remaining expensive on an intrinsic basis.
Among practical stock valuation techniques , disagreement is useful. It can reveal that a DCF assumes better margins than peers, or that a low P/E reflects weak growth, leverage or earnings quality.
Discounted Cash Flow (DCF) Valuation Explained
DCF valuation treats an asset as the present value of future cash flows. Analysts can discount free cash flow to the firm at weighted average cost of capital to obtain enterprise value, or discount free cash flow to equity at the cost of equity to obtain equity value directly.
Do not mix the cash flow and discount rate. FCFF belongs with WACC; FCFE belongs with cost of equity. After an enterprise-value DCF, add excess cash and non-operating assets, then subtract debt and other claims before dividing by diluted shares.
A standard model forecasts an explicit period and a terminal value. The perpetual-growth terminal formula is next-period cash flow divided by WACC minus stable growth. Because terminal value can dominate the result, stable growth must remain below the discount rate and economically plausible.
The most important stock valuation techniques around DCF are scenario analysis and sensitivity testing. Model base, downside and upside cases, then show how value changes across WACC and terminal-growth assumptions instead of presenting a false-precision point estimate.
Dividend Discount Model (DDM): When and How to Use It
ddm valuation estimates equity value as the present value of expected dividends. The Gordon growth version is D₁ ÷ (kₑ − g), where D₁ is next year’s dividend, kₑ is cost of equity and g is sustainable perpetual dividend growth.
The model fits mature dividend-paying businesses with a payout policy that relates sensibly to profitability. CFA Institute notes that a dividend approach is most suitable when dividends are observable and connected to earnings, while free-cash-flow models may be preferable when dividends diverge from capacity.
Banks and financial companies are common candidates because debt is part of operations and FCFF can be difficult to define. Even then, ddm valuation can mislead when dividends are constrained, temporarily boosted, or disconnected from sustainable return on equity and capital requirements.
A two-stage model handles faster near-term growth followed by stable growth. As with DCF, the gap between discount rate and terminal growth is critical; a narrow denominator makes the estimate highly sensitive.
Relative Valuation: P/E, P/B and EV/EBITDA Multiples
Relative stock valuation compares the company with peers or its own history. P/E links equity value to earnings, P/B links it to book equity, and EV/EBITDA compares enterprise value with a pre-interest operating measure.
| Multiple | Useful for | Watch-outs |
|---|---|---|
| P/E | Profitable businesses with comparable accounting | Capital structure, one-offs and cyclical earnings |
| P/B | Banks and asset-heavy businesses where book value matters | Asset quality, write-offs and intangible value |
| EV/EBITDA | Comparing operations across different debt levels | Ignores capex, working capital and taxes |
Peers should resemble the subject in business mix, geography, growth, margins and risk. Comparing a premium compounder with a low-quality cyclical company simply because both share an industry label can produce a meaningless median.
Good stock valuation methods normalise earnings, use consistent trailing or forward periods and reconcile enterprise and equity metrics. A low multiple can signal opportunity, but it can also reflect weaker economics.
Get research like this in your inbox
The week’s research that mattered, in five minutes. Joined by 2L+ investors.
How to Value a Stock: Step-by-Step Example
To illustrate how to value a stock , consider a hypothetical company with FCFF of ₹100 crore next year, rising to ₹140 crore by year five. Assume 10% WACC, 4% perpetual growth, ₹300 crore debt, ₹100 crore cash and 100 crore diluted shares.
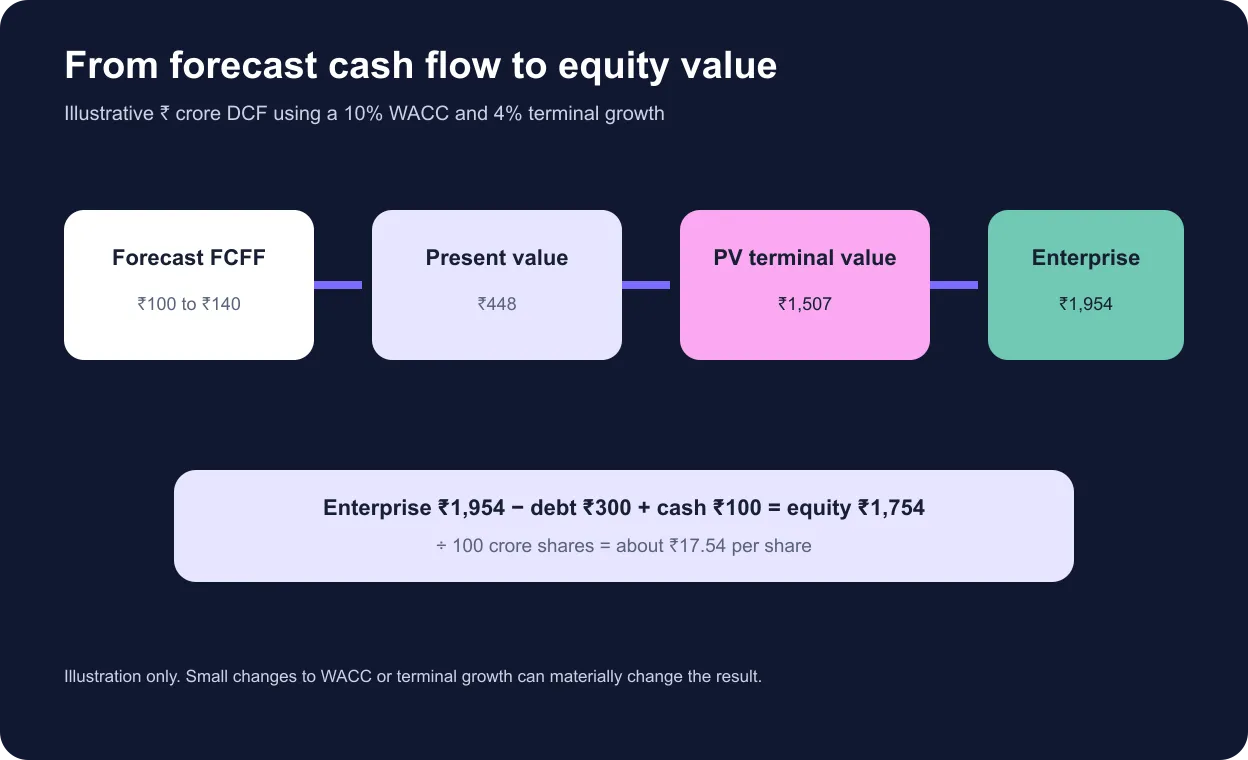
The present value of five forecast cash flows is about ₹448 crore. Terminal value is ₹2,427 crore at year five and approximately ₹1,507 crore today. Enterprise value is therefore roughly ₹1,954 crore.
Subtract debt and add cash to obtain equity value of about ₹1,754 crore. Dividing by 100 crore shares gives ₹17.54 per share. This DCF valuation example is not a recommendation; it demonstrates the bridge from operations to equity.
Next, test 9% to 11% WACC and 3% to 5% terminal growth. Compare the range with peer multiples and market price. Learning how to value a stock means understanding which assumptions create the conclusion.
Choosing the Right Stock Valuation Method
Use DCF when operating cash flows are forecastable and reinvestment can be modelled. Use ddm valuation for stable dividend payers whose distributions reflect cash-generation capacity. Use multiples when a credible peer set exists and accounting measures are comparable.
High-growth, loss-making businesses may require revenue multiples and a path-to-margin model, not current P/E. Banks often suit P/B, residual income or DDM. Commodity companies require mid-cycle assumptions because spot earnings can distort every method.
A decision table improves consistency. It should specify the valued claim, cash-flow definition, discount rate, forecast horizon, terminal method and cross-check. These stock valuation methods in India should also account for promoter governance, liquidity and country-specific risk.
The best answer to how to value a stock is often a range supported by two or more methods, with an explanation for each gap.
Common Mistakes While Valuing a Stock
First, investors extrapolate recent growth without modelling the reinvestment needed to achieve it. Growth creates value only when returns on incremental capital exceed the cost of capital.
Second, they mismatch FCFF with cost of equity or FCFE with WACC. Third, they count cash twice or forget debt, leases, minority interests, options and diluted shares when moving from enterprise to equity value.
Fourth, relative stock valuation becomes a peer-shopping exercise: analysts choose expensive peers to justify a desired value. Fifth, one-off earnings and cyclical peaks are treated as normal.
Finally, analysts hide uncertainty behind decimals. Sound stock valuation techniques use ranges, scenarios and documented assumptions. A margin of safety is not a substitute for correcting a weak model.
Limitations of Valuation Models
Every model is conditional. DCF valuation becomes unreliable when cash flows are deeply negative, the business model is changing, leverage is unstable or long-term assumptions dominate. ddm valuation ignores value retained outside dividends when payout policy does not reflect capacity.
Multiples inherit market errors. If an entire sector is overpriced, a stock can look cheap relative to peers while remaining expensive intrinsically. Accounting choices also make reported earnings, book value and EBITDA less comparable than the labels suggest.
stock valuation cannot eliminate surprises in competition, regulation, technology, capital allocation or governance. Its role is to organise uncertainty, not erase it. Update the model when facts change rather than moving assumptions merely to track price.
How Wright Research Approaches Stock Valuation
Wright Research combines fundamental context with systematic evidence. The process begins with business economics, financial quality, balance-sheet risk and cash-flow conversion before applying suitable stock valuation methods.
Intrinsic models make growth, margins, reinvestment and discount rates explicit. Relative models compare consistent peers and multiple histories. Quantitative signals can provide additional information on quality, momentum, volatility and market behaviour, but they do not turn valuation into certainty.
Each estimate is tested across scenarios and checked for sensitivity. The final output is a range and an investment thesis with conditions that would invalidate it. Readers can review Wright Research’s guide to stock valuation and use the stock valuation techniques glossary for model terminology.
The objective is repeatability. A disciplined answer to how to value a stock should be auditable, evidence-based and capable of being updated when disclosures change.
Build a sensitivity range instead of one target price
A valuation is more useful when it reveals which assumptions matter. Start by changing one driver at a time, then combine coherent assumptions into scenarios. Revenue growth, operating margin, reinvestment, WACC and terminal growth should move in economically consistent ways rather than being selected independently to create a desired result.
In the worked example, a lower discount rate or higher terminal growth raises value because distant cash flows receive more weight. The opposite assumptions reduce value. This sensitivity is not a defect in DCF valuation ; it is a warning that long-duration businesses require wider ranges and stronger evidence.
| Scenario | WACC | Terminal growth | Interpretation |
|---|---|---|---|
| Downside | 11% | 3% | Higher required return and slower mature growth |
| Base | 10% | 4% | Central operating and risk assumptions |
| Upside | 9% | 5% | Lower risk and stronger durable growth |
Do not average unrelated outputs mechanically. If intrinsic stock valuation is below the peer-implied value, investigate whether the peer group assumes superior growth, whether the sector is expensive, or whether the DCF is too conservative. Reconciliation is diagnosis, not an exercise in forcing every method to agree.
Document an evidence threshold for each important input. Growth may be supported by capacity, market share and industry demand. Margins may depend on pricing power and operating leverage. Discount rates should reflect business and financial risk. Terminal assumptions should describe a mature company rather than extend exceptional performance forever.
Compare estimated value with price using a margin-of-safety policy that reflects uncertainty. A regulated utility with stable cash flows may justify a narrower range than an early-stage platform company. Sound stock valuation methods adjust confidence to forecastability, while robust stock valuation techniques keep downside cases visible.
Update the model after results, acquisitions, capital raises or material governance events. A repeatable stock valuation process preserves earlier assumptions so investors can see whether the business changed or the narrative merely followed the share price. This audit trail is as important as the spreadsheet.
For portfolio decisions, translate stock valuation into position sizing and monitoring rules. Estimated upside without liquidity, governance and concentration limits can still create an unsuitable investment. Valuation informs the decision; it does not replace portfolio risk management.
A final review should be reproducible by another analyst. Preserve source dates, distinguish reported figures from estimates, reconcile forecast statements and record why each peer was selected. Check that terminal economics fit the mature competitive position and that diluted shares include outstanding options or convertibles. When market price differs sharply from estimated value, search for missing information before assuming the market is wrong. Independent review is most valuable where the model is most sensitive.
Is your portfolio built for what’s coming?
Get a free AI-powered review of your holdings — risk, overlap and quality in minutes.
FAQ
What is the best method to value a stock?
There is no universal best method. DCF suits forecastable cash flows, DDM suits stable dividend payers, and relative valuation works when comparable companies and consistent metrics are available.
What is DCF valuation with example?
DCF estimates value by discounting forecast free cash flows and terminal value. In the worked example, projected FCFF and terminal value produce enterprise value, which is adjusted for debt, cash and shares to estimate value per share.
What is the difference between DCF and DDM?
DCF can use free cash flow to the firm or equity. DDM discounts expected dividends and is most useful when dividends reflect sustainable equity cash generation.
How do you calculate intrinsic value of a stock?
Forecast appropriate cash flows, select a risk-consistent discount rate, estimate a defensible terminal value, adjust for non-operating assets and claims, and divide equity value by diluted shares.
How do I choose the right stock valuation method?
Match the method to the business model, cash-flow visibility, capital structure and payout policy. Use more than one method when possible and explain why results differ.
Is P/E ratio a valuation method?
Yes. P/E is a relative valuation multiple. It compares equity price with earnings, but meaningful use requires consistent earnings definitions and peers with reasonably similar growth and risk.
Investors comparing stock valuation methods should prefer a transparent range over a precise but fragile target. Revisit stock valuation whenever cash-flow, risk or capital-allocation evidence changes.


