


The US-Israeli strikes on Iran that began on February 28, 2026, and Iran's subsequent effective closure of the Strait of Hormuz, have done more than disrupt oil markets. They have triggered a severe shock to global fertilizer supply chains, one that is already deeper and more complex than the disruptions seen during the 12-day Israel-Iran war in June 2025, and one that carries echoes of the 2022 Russia-Ukraine fertilizer crisis.
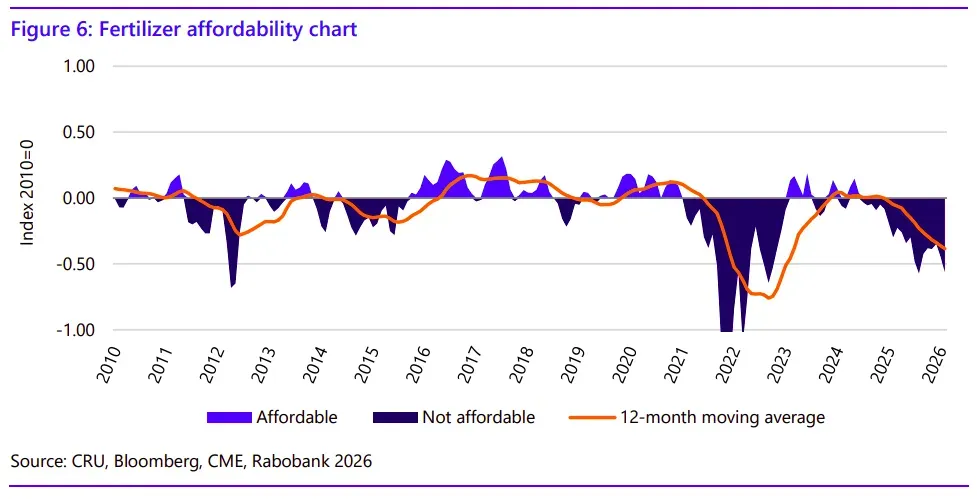
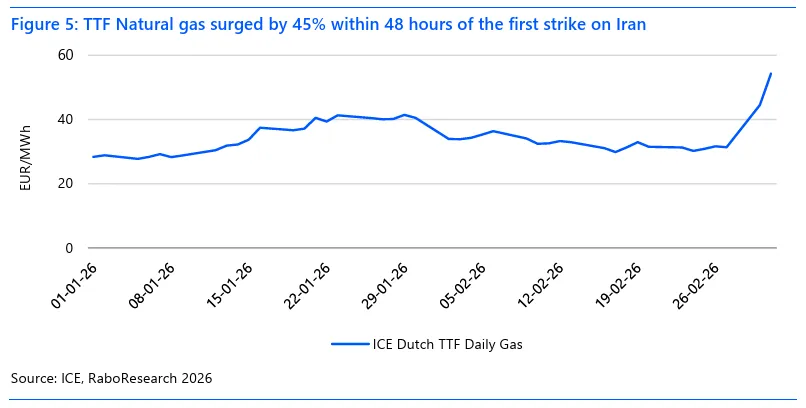
Within 48 hours of the first strike, North African urea prices surged by nearly 20%. EU natural gas at the Dutch TTF jumped by roughly 45%. By March 11, global urea benchmark prices had risen approximately 26%, from $465.5 per metric ton to $585 per metric ton. Some estimates put the spike even higher, Bloomberg data shows urea hitting a three-year high with a 21% jump in the first week of the war alone. The Rabobank urea affordability index, which measures how affordable fertilizers are relative to crop prices, has fallen to its second-lowest level since 2010, surpassed only by the 2022 Russia-Ukraine crisis peak.
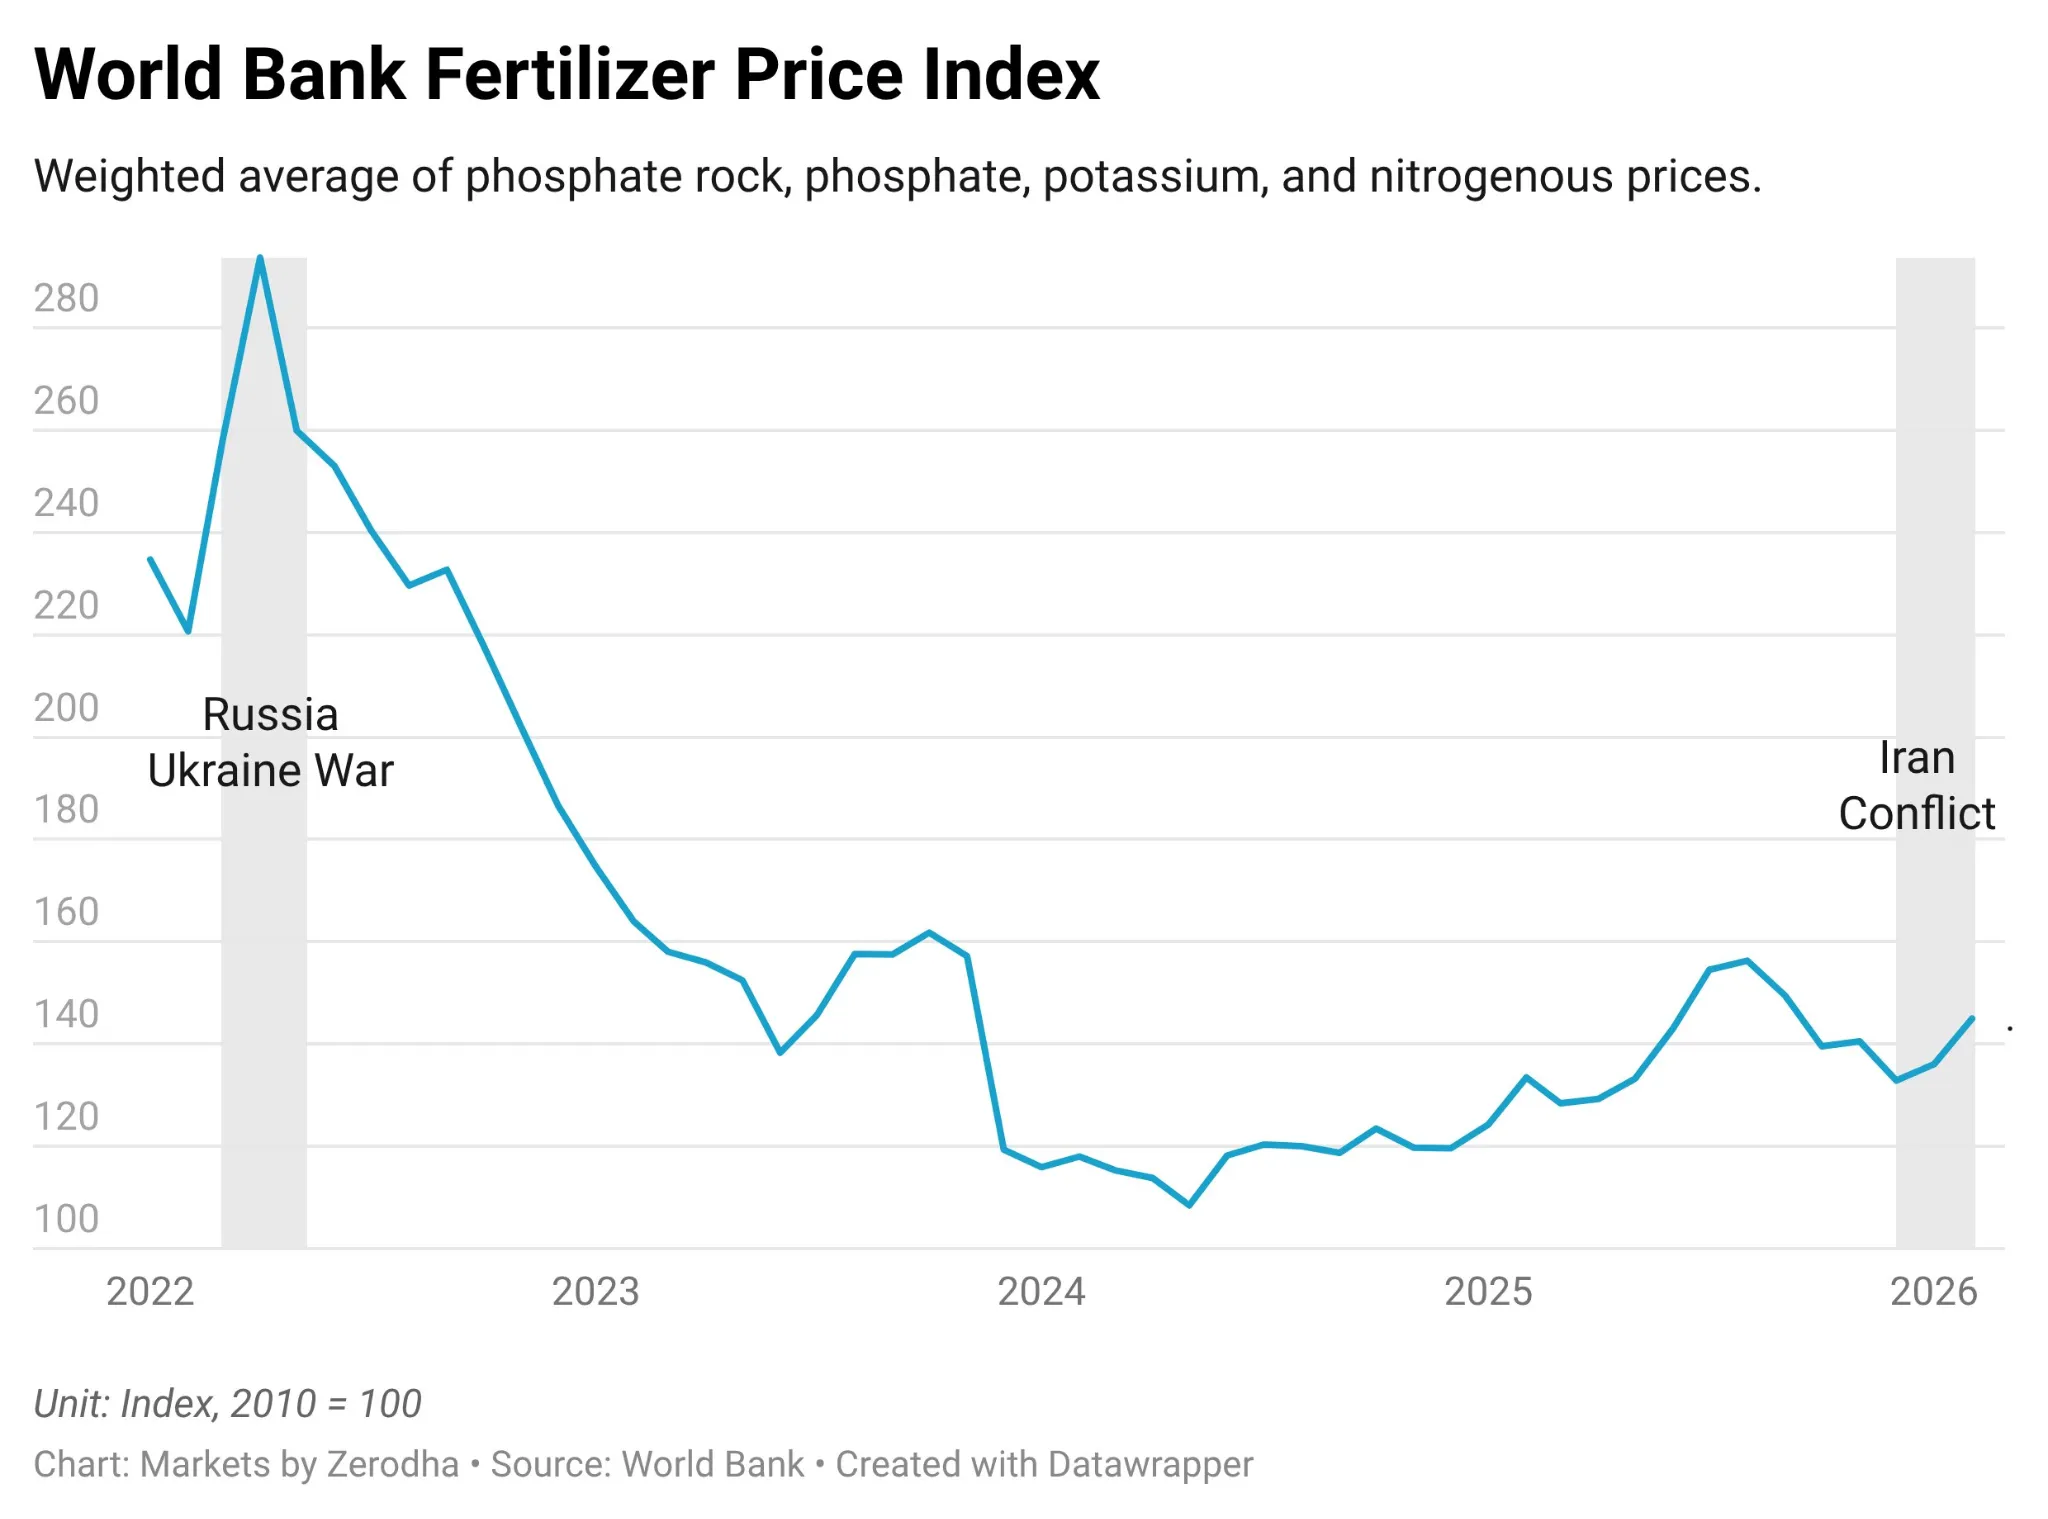
This is a global problem and for India, one of the world's largest fertilizer consumers, it is an especially acute one.
Why the Strait of Hormuz Matters for Fertilizers?
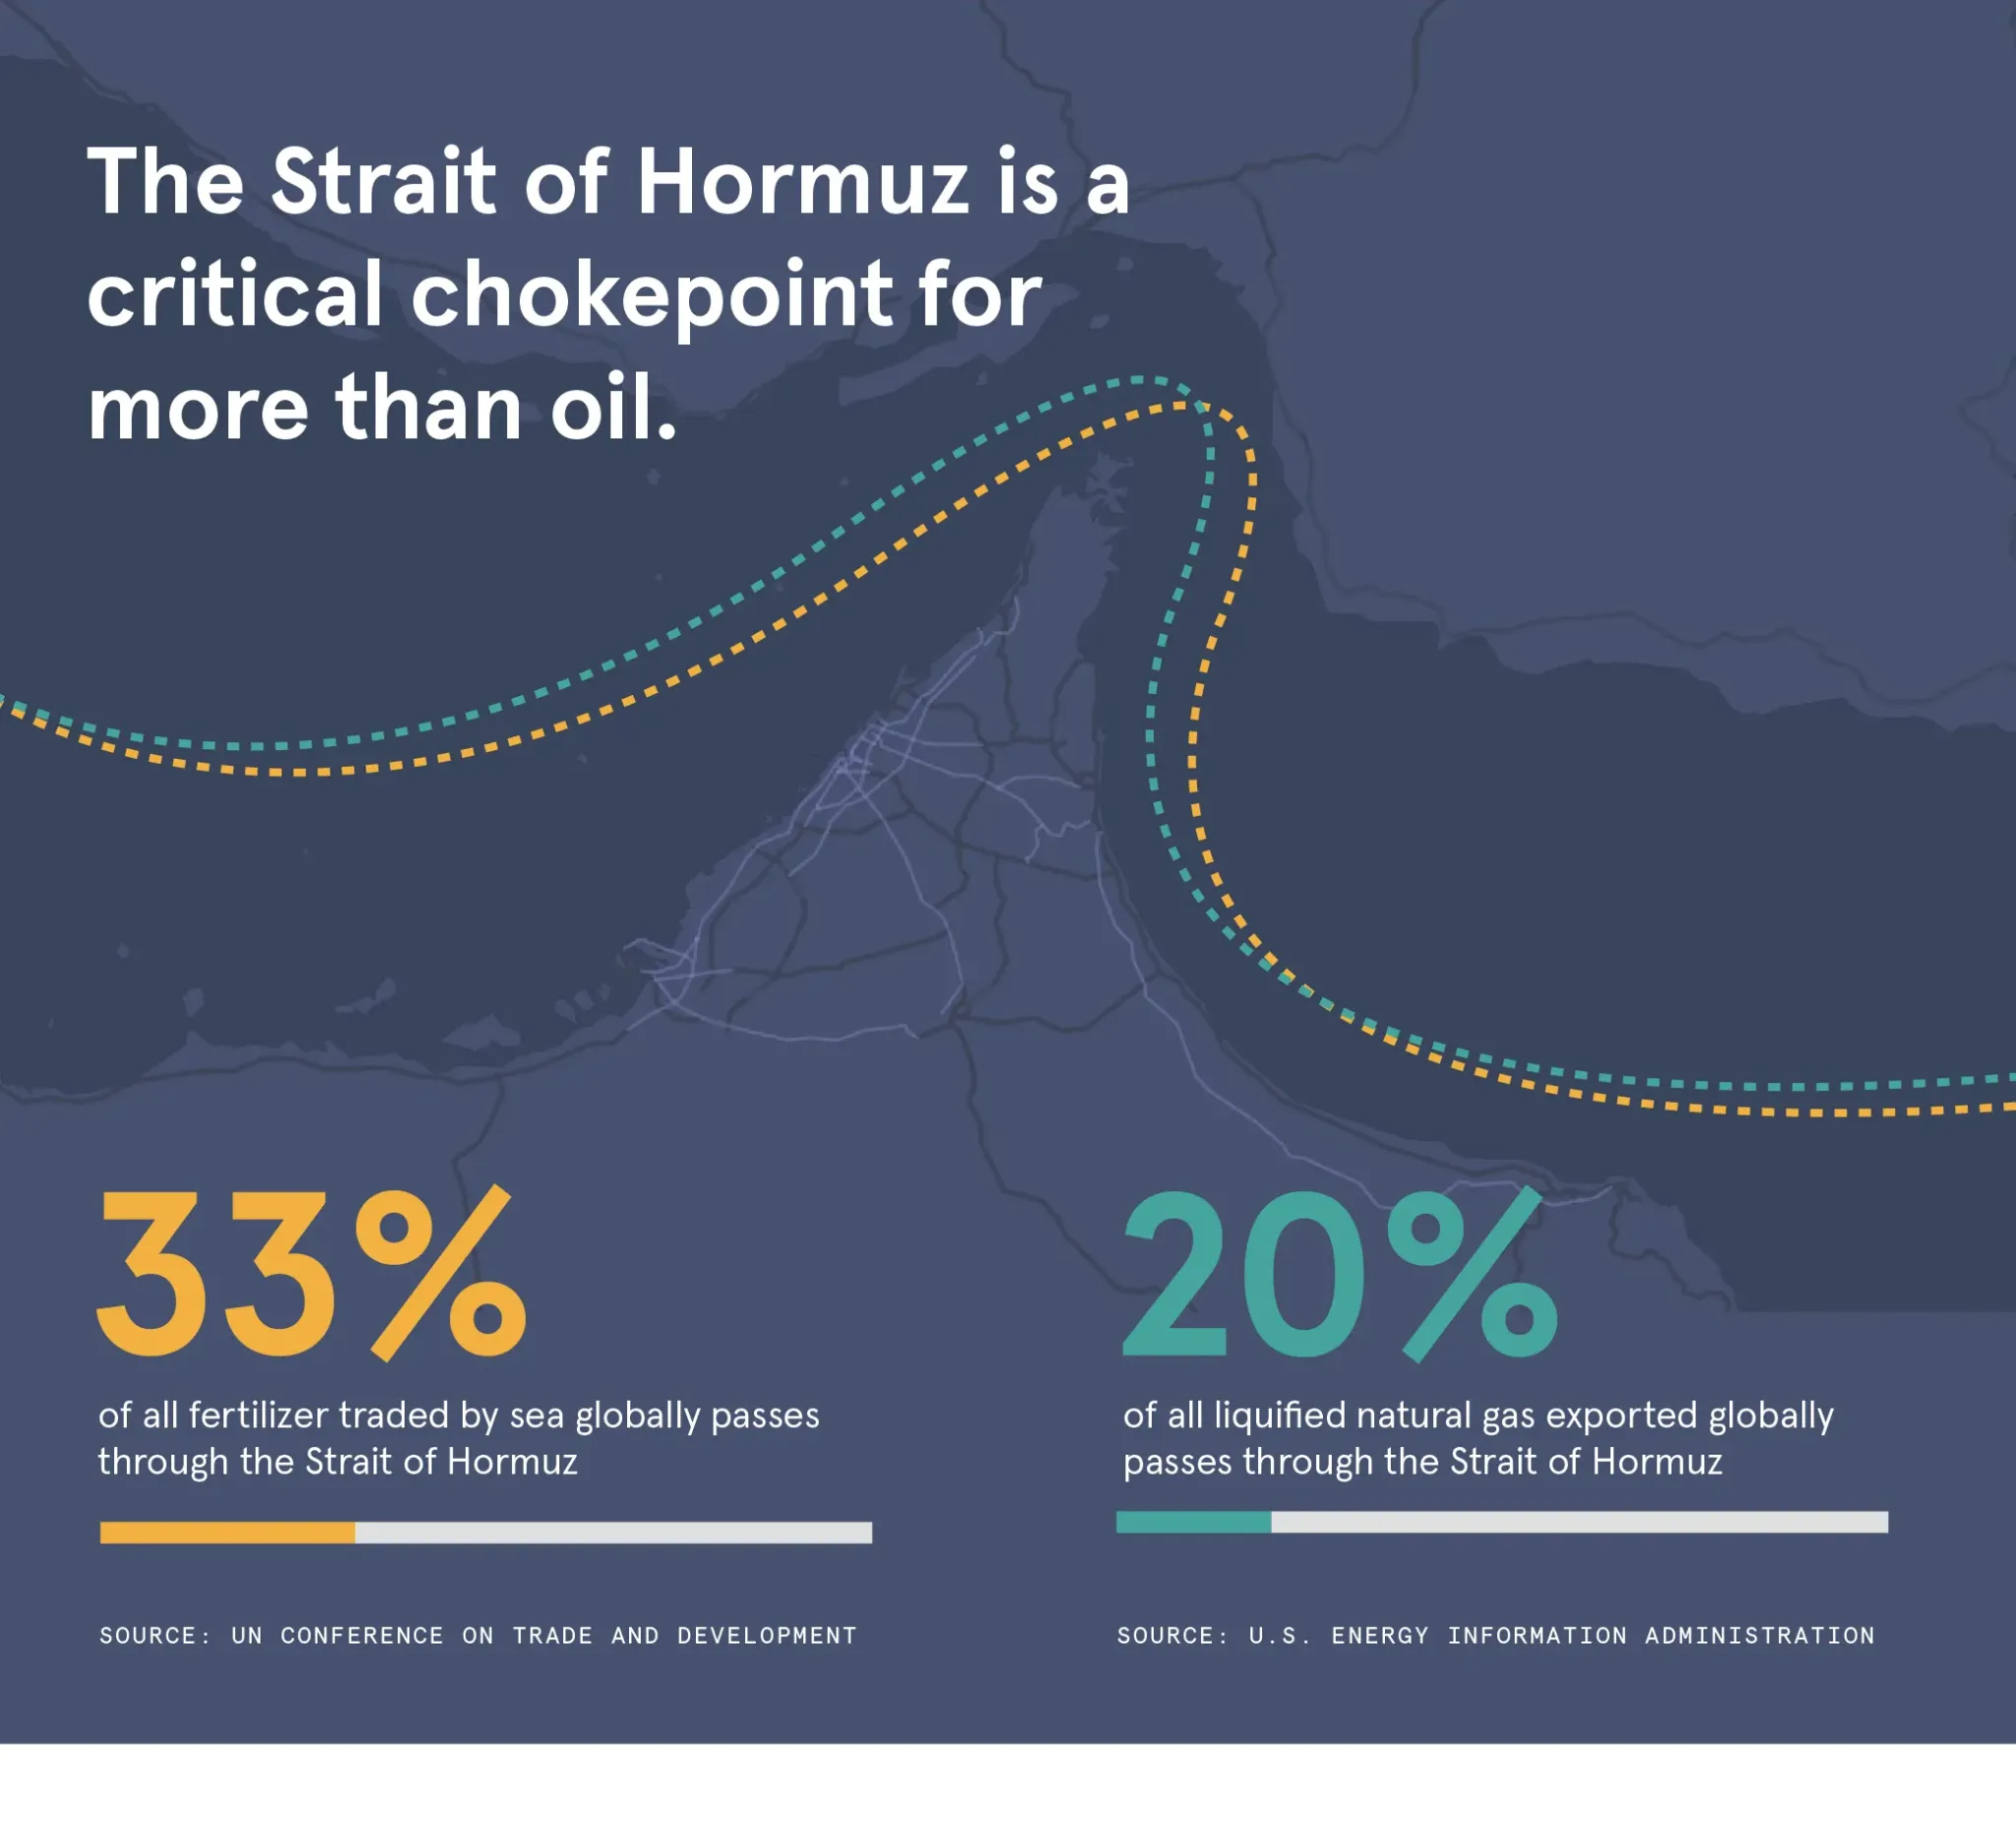
The Strait of Hormuz is a 33-kilometer-wide channel between Iran and Oman. It is the only maritime link between the Persian Gulf and the open ocean. 1/5th of global oil and gas flows through it. But its role in fertilizer markets is equally critical and far less discussed.
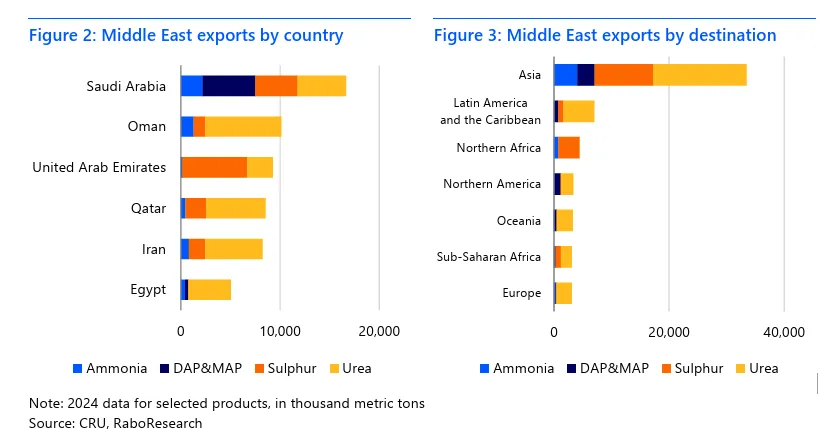
The Persian Gulf sits at the center of global fertilizer production for two structural reasons. First, the region has access to some of the world's cheapest natural gas, the essential feedstock for ammonia production. Second, decades of capital investment have built massive ammonia and urea production capacity in Qatar, Saudi Arabia, the UAE, and Oman.
About 25–30% of the world's nitrogen fertilizer exports pass through the Strait. Roughly 1/3rd of global seaborne fertilizer trade transits this route. Since the strikes, vessel traffic through the Strait has been reduced to a trickle. Ships have been attacked and set ablaze. Sea mines have reportedly been deployed. Insurance premiums have surged. Most shipping companies have suspended journeys through the Strait entirely.
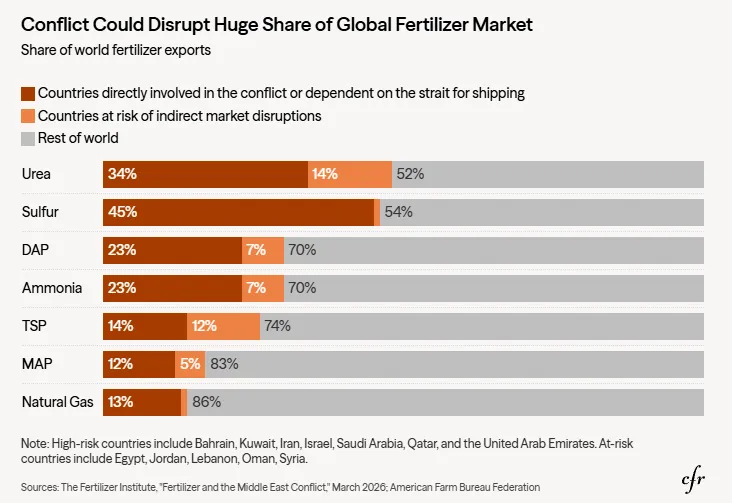
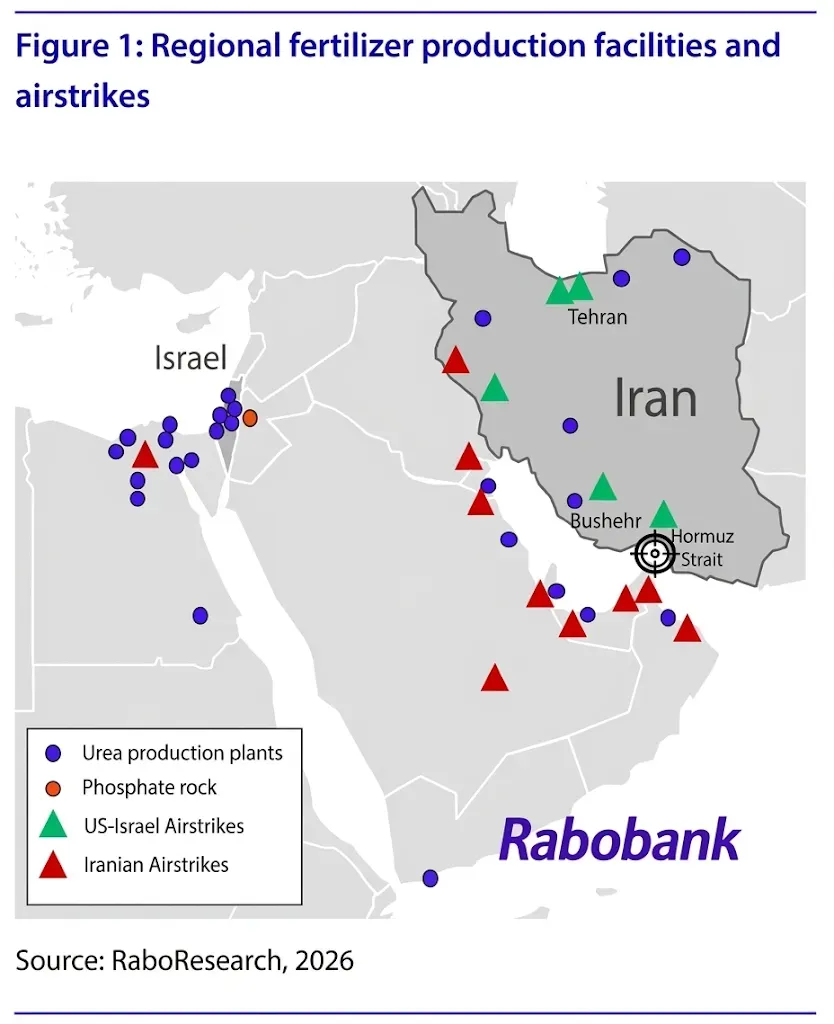
But the disruption extends well beyond Hormuz itself. The broader regional conflict has affected fertilizer-related assets in Egypt, Algeria, Israel, and Jordan. Israel has halted gas exports to Egypt under force majeure, while gas that is essential for Egypt's domestic nitrogen production. LNG facilities in the Gulf have been damaged. Saudi refineries are reducing runs. Algerian and Egyptian producers are facing operational constraints.
When you factor in the full regional picture of Hormuz transit and production disruptions across the Gulf, North Africa, and the Eastern Mediterranean, the volumes at risk are staggering: approximately 44% of global urea exports, 27% of global ammonia exports, 25% of global phosphate fertilizer exports, 47% of global sulphur exports, and 36% of global phosphate rock exports. They are structurally significant shares of globally traded fertilizer commodities.
Check the macro backdrop
GDP, inflation, rates and more — India’s key economic indicators in one dashboard.
The Global Transmission Channels
The disruption operates through several channels simultaneously, each reinforcing the others.
Raw material and production shortages:
The Gulf is not just a transit route for fertilizers. It is where a large share of the world's nitrogen fertilizers are actually produced. Countries directly exposed to the Hormuz disruption account for nearly half of global urea exports. Urea production has already been curtailed in the region, and downstream production across North Africa has been hit by the loss of gas supply from Israel and reduced LNG availability. Fertilizer firms in India, Bangladesh, Pakistan, and Egypt have had to shut down or cut production due to loss of natural gas supply from Qatar and other Gulf sources.
Shipping and insurance collapse: Even where fertilizer stocks are physically available at factories, ships are not moving them. Marine insurers have either pulled war-risk coverage entirely or are demanding prohibitively high premiums. Cargo insurance cancellations immediately constrain supply. A ship captain willing to brave drone strikes through Hormuz would prefer to carry oil which is worth more per tonne rather than fertilizer.
Price transmission across global markets: Because fertilizers are globally traded commodities, a supply disruption in the Gulf raises prices everywhere. It does not matter whether a specific country bought directly from a Gulf producer. The global benchmark re-prices, and every importer and domestic producer feels the impact. Egyptian granular urea prices jumped from $495–505/mt FOB to $610–625/mt within days. Algerian producers, overwhelmed by buyers seeking safer supply routes, saw prices surge to $631/mt.
Force majeure cascading through the value chain: A critical near-term concern is the invocation of force majeure clauses across the supply chain. India was recently awarded March-delivery urea tender as the most closely watched case, suppliers may be unable to fulfil obligations. Similar force majeure claims could arise from upstream suppliers to national buyers, distributors, and ultimately at the farm level.
What Type of Fertilizers Are At Stake?
The crisis is not limited to nitrogen fertilizers. Phosphate fertilizer production depends on two key inputs: ammonia and sulphur. Both are under severe stress.
Sulphur is largely a byproduct of oil and gas refining. If energy shipments through Hormuz are disrupted, sulphur output falls alongside fuel exports. About 50% of global sulphur trade is now at risk due to the conflict. Sulphur prices had already surpassed 2022 levels in the second half of 2025 due to production issues in Kazakhstan and Russian export constraints. The current conflict adds another layer of pressure.
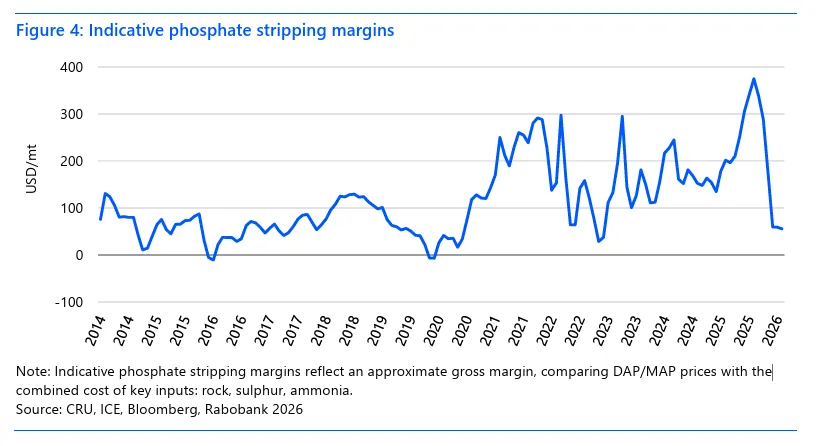
Ammonia prices jumped 15–28% in recent days. DAP (phosphate fertilizer) has a stronger price correlation with ammonia (~0.65 R²) than with sulphur (~0.45 R²). A roughly 33% increase in current ammonia prices would push many phosphate producers globally into negative margin territory. Smaller, sub-scale phosphate facilities in Brazil have already been forced offline, and more could follow.
This means the crisis is compounding: nitrogen fertilizers are directly disrupted by the loss of Gulf gas and urea production, while phosphate fertilizers are being squeezed through rising input costs for both ammonia and sulphur.
What Is The Impact Of Fertilizer Imports On Europe?
The Persian Gulf's direct share of Europe's fertilizer supply is small, only 1–2% of EU nitrogen and ammonia imports. But the indirect impact is severe. Egypt and Algeria together supply more than 30% of Europe's imported nitrogen and ammonia. Both are now facing production disruptions and surging prices.
European natural gas at the Dutch TTF surged 45% in a single day, jumping from EUR 31/MWh to EUR 45/MWh after news of Qatar halting LNG production. This directly increases the cost of European ammonia and urea manufacturing. Several European plants withdrew their price offers within hours, unable to quote for more than brief two-hour windows as gas markets fluctuated.
European farmers were already paying about 25% more for nitrogen fertilizers in early 2026 compared to early 2025, partly due to rising EU ETS and CBAM compliance costs, and partly due to higher EU import tariffs on Russian and Belarusian fertilizers introduced in mid-2025. Russian nitrogen's share of EU imports dropped from 27% in 2024 to just 3% in the first two months of 2026. The war has now added yet another cost layer on top of an already strained market.
There is a temporary cushion: record pre-CBAM urea imports in late 2025 created a buffer, and most European farmers had already purchased their spring application fertilizers by late February. But this cushion will not last if the disruption extends beyond the near term.
Get research like this in your inbox
The week’s research that mattered, in five minutes. Joined by 2L+ investors.
The China Variable
China is the world's largest urea producer and controls exports under a quota system. It has not yet allocated outbound shipment allowances for 2026. Current market expectations are that China will resume urea exports sometime in Q2, with phosphate exports likely delayed until August or later.
However, a sharp rise in global fertilizer prices can quickly alter China's policy calculus. Surging international prices create export arbitrage opportunities and lift domestic prices, precisely the outcomes Beijing seeks to avoid. While Chinese authorities will prioritize domestic spring planting supply, further market volatility could prompt tighter inspections or renewed restrictions rather than the relaxation the global market is hoping for.
India has already taken the unusual step of asking China to allow the sale of urea cargoes and consider easing restrictions. Discussions between government officials are ongoing. India is also exploring alternative suppliers from Russia, Indonesia, Malaysia, and Egypt. But none of these can quickly replace the volumes at risk from the Gulf.
India: The Specific Vulnerability
India is one of the world's largest fertilizer consumers. Its exposure to the Hormuz crisis runs through multiple layers.
India produces about 87% of its urea domestically. But urea production requires natural gas as its primary raw material where 70–80% of the cost of making urea is gas. India's domestic gas supply does not cover its full urea production needs; the shortfall is imported, largely as LNG from Qatar through Hormuz. India also imports roughly 60% of its DAP, mostly from Saudi Arabia and the Middle East. And it imports 100% of its potash requirement, having no commercially exploitable reserves.
On March 3, 2026, Petronet LNG, India's largest gas importer, invoked force majeure, declaring that its LNG vessels could no longer safely transit Hormuz to reach Qatar's Ras Laffan terminal. It served notices on GAIL, IOC, and BPCL. GAIL immediately began cutting gas allocations to industrial customers. GNFC disclosed that its allocation was cut to 60% of its daily contracted quantity starting March 6. Some urea producers have shut down plants entirely or moved up annual maintenance.
By March 9–10, the government formalized the rationing through the Natural Gas (Supply Regulation) Order, 2026, issued under the Essential Commodities Act. The priority hierarchy: households get 100% allocation (piped gas, CNG, LPG). Fertilizer plants get 70% of their six-month average consumption. General manufacturing gets 80%. Refineries and petrochemicals get 65%.
India's fertilizer reserves as of March 6 were up 36.5% year-on-year. Using the previous kharif season's sales as a benchmark, this provides roughly 1.8 months of urea cover, 3.4 months of DAP, and 3.3 months of NPK. In FY26, India had imported 9.8 million tonnes of urea, with another 1.7 million tonnes scheduled to arrive in the next three months. A new import tender is expected by late March or early April.
The Fertiliser Association of India has said immediate availability is adequate for the coming kharif season. But it has also warned that shortages in imported fertilizers are expected if the war continues. Projected fertilizer imports for FY26 were expected to hit a record $18 billion, with urea comprising about 61%.
The Fiscal and Farmer Impact
India's fertilizer subsidy system is designed to absorb global price shocks before they reach the farmer. Urea has a statutorily controlled retail price. Phosphate and potash fertilizers sit under a nutrient-based subsidy framework. When global prices spike, the first hit is to the government's subsidy bill and then the farmer's pocket.
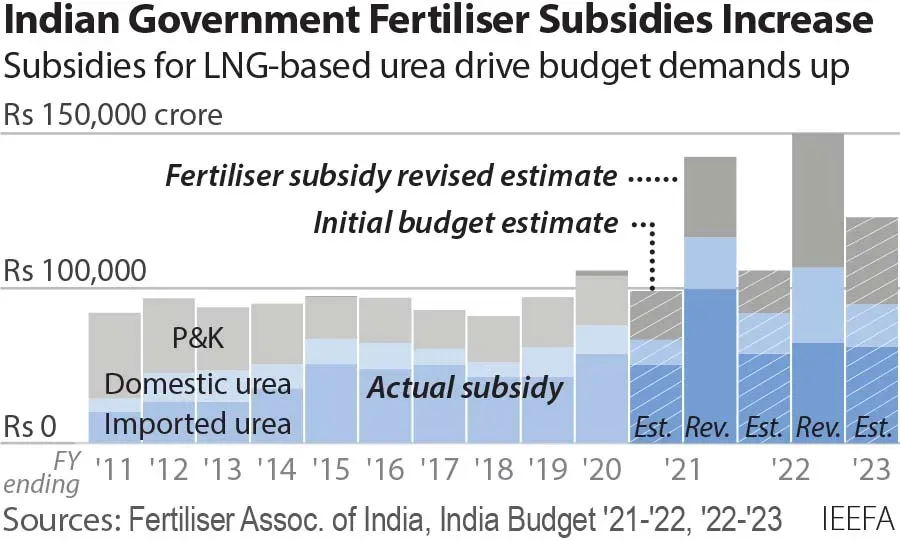
The government had provisionally set its 2026–27 fertilizer subsidy at ₹1.71 lakh crore. CRISIL has warned that higher international prices combined with reduced LNG availability would push subsidy needs well above this figure. S&P Global analysts suggest the government is prepared to pay a premium to avoid farmer discontent, particularly given the April–May election cycle. India faced a comparable situation in 2022, when the Russia-Ukraine war pushed urea briefly to $900 per tonne and forced the fertilizer subsidy bill far above budget.
Globally, the picture is similar. Fertilizers typically account for 40–50% of grain variable costs, making price shocks immediately visible in farm budgets. With fertilizer prices rising faster than agricultural commodity prices, grain and oilseed markets have comfortable inventories and face no direct supply disruption, the cost-price gap for farmers is widening worldwide. This divergence is a key dynamic since fertilizer prices are likely to remain elevated while crop prices stay comparatively stable, compressing farmer margins across the board.
See what markets are pricing in
Live indices, sector moves and market breadth — the backdrop to every story we publish.
What Happens Next For The Fertilizer Industry?
A short disruption resolved by mid-April would mostly mean higher import costs and temporary rationing, which is painful but manageable. Fertilizer companies have moved maintenance shutdowns into March to conserve gas for when plants need to run at full capacity ahead of June's kharif sowing season. India's buffer stocks are materially higher than in 2022, and the lean season provides a natural cushion.
But a prolonged disruption running into May and June changes the calculus entirely. That is when physical shortages could hit specific states, crops, and farmers at the worst possible moment. Globally, if the conflict persists, fertilizer affordability will deteriorate further, increasing the risk of reduced application rates and demand rationing through 2026. There is no meaningful strategic reserve for nitrogen fertilizers globally, unlike oil, there is no equivalent stockpile to buffer shocks.
Even if the war stops tomorrow, restarting production and transport for fertilizers could take weeks, at a crucial moment for planting seasons across the Northern Hemisphere.
The situation is serious. It is not yet at 2022 crisis levels. But the structural exposure is arguably worse, because this time, the disruption hits both transit and production simultaneously, across a wider geographic area, with fewer alternative suppliers available.


