


Markets rarely announce a regime change in real time. Prices move first, while earnings, liquidity and sentiment develop at different speeds. That is why identifying a bull market or a bear market requires a dashboard rather than one headline or one red week.
The practical bull vs bear market question is not about predicting the exact top or bottom. Investors need to recognise whether price trends are broadly supported, whether risk is spreading through the market and whether their portfolio still fits its objective.
Bull Market vs Bear Market: The Basics
SEBI describes a bull market as a phase of rising stock prices and investor optimism, often associated with improving economic and business conditions. A bear market is a phase of falling prices and negative investor outlook, which can accompany economic weakness, recession concerns or shocks.
A popular convention calls a decline of about 20% from a significant peak a bear phase and a 20% rise from a low a bull phase. This is a useful label, not a law. Results change with the chosen index, currency, closing date and whether dividends are included.
| Dimension | Bull phase | Bear phase |
|---|---|---|
| Price structure | Higher highs and higher lows over time | Lower highs and lower lows over time |
| Participation | More stocks and sectors join advances | Declines broaden or leadership narrows |
| Earnings | Upgrades and improving profit expectations | Downgrades and margin pressure |
| Risk appetite | Higher willingness to own cyclical or growth assets | Preference for cash, defensives or quality |
| Main behavioural risk | Overconfidence and overpaying | Panic selling and abandoning the plan |
The bull market vs bear market comparison describes the dominant trend. It does not mean every stock moves in the same direction or that daily volatility disappears.
A regime label also depends on the benchmark. Large-cap indices can remain firm while small-cap shares experience deep drawdowns, and sector indices can enter different phases at the same time. Compare a portfolio with the market segment it actually owns before drawing a conclusion from the Nifty 50 alone.
Another bull vs bear market distinction is the path of recovery. A loss of 20% requires a subsequent gain of 25% to return to the starting value. A 50% decline requires a 100% gain. This asymmetry makes drawdown control, diversification and avoidance of forced selling important even when the long-term outlook remains constructive.
See what markets are pricing in
Live indices, sector moves and market breadth — the backdrop to every story we publish.
How to Tell If You're in a Bull or Bear Phase
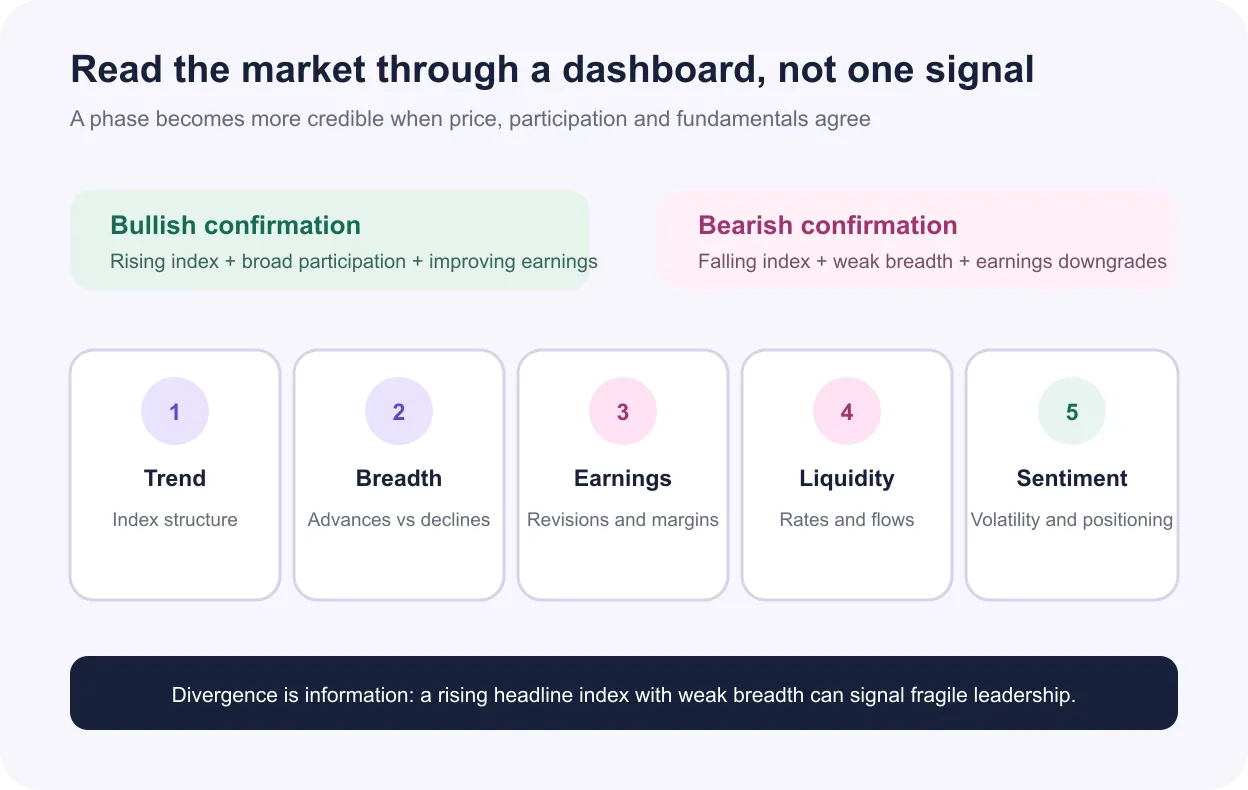
Start with the primary index and then test whether its movement is confirmed elsewhere. An investor asking whether this is a bull or bear market should review price trend, breadth, earnings, valuations, flows, interest rates, liquidity and volatility over consistent periods.
Time horizon matters. A 10% correction inside a multi-year bull market may be severe for a leveraged trader but ordinary for a long-term investor. A short rebound can occur inside a longer declining phase.
A disciplined framework for how to identify a bear market looks for persistence and confirmation. Record signals on scheduled review dates rather than changing the definition after prices move.
Indicator 1: Market Breadth and Index Trends
The index trend is the first layer. Investors can compare the current level with medium- and long-term moving averages, recent peaks and troughs, and the sequence of highs and lows. A rising index above an upward-sloping long-term average supports a bull market reading, but it is not sufficient.
Market breadth asks how many securities participate. Advance-decline data, the percentage of stocks above key moving averages, new highs versus new lows and equal-weighted versus market-cap-weighted indices can reveal whether strength is broad.
A headline index can rise because a few large companies are strong while most constituents fall. That divergence may signal a fragile bull or bear market transition. Conversely, improving breadth before the headline index breaks out can indicate internal recovery.
The right comparison uses the same universe. Breadth for all NSE-listed shares should not be treated as if it exactly represents the Nifty 50.
Indicator 2: Earnings Growth and Valuations
Prices ultimately compete with the earnings and cash flows investors expect. A durable bull market is easier to justify when aggregate earnings estimates rise, revenue growth broadens and margins hold. If prices rise while estimates fall, valuation multiples expand and the market becomes more dependent on optimism.
Review trailing and forward P/E, price-to-book, earnings yield and sector composition. High valuation alone does not time a reversal. Fast-growing, profitable companies can remain expensive, while a low multiple can reflect deteriorating fundamentals.
In the bull market vs bear market framework, valuation is a vulnerability measure rather than a trigger. Expensive markets can keep rising until earnings disappoint, discount rates increase or liquidity tightens.
Track the direction and breadth of analyst revisions, not only the aggregate number. Upgrades concentrated in one commodity sector tell a different story from broad upgrades across banks, consumption, industrials and technology.
Get research like this in your inbox
The week’s research that mattered, in five minutes. Joined by 2L+ investors.
Indicator 3: FII/DII Flows
Foreign portfolio investor and domestic institutional investor flows influence marginal demand, but daily net figures are noisy. Strong FPI buying can support a bull market , while sustained selling can intensify declines. Domestic mutual fund, insurance and pension flows can offset some pressure.
Interpret flows with currency, global risk appetite, relative valuations and earnings. Foreign selling may reflect global redemptions rather than a negative view on every Indian company. Domestic buying may arise from systematic contributions and does not guarantee an immediate floor.
The bull market vs bear market signal is stronger when price, breadth and multi-week flows agree. If institutions buy while the index fails to advance, supply may still be absorbing demand.
| Observation | Possible reading | Required cross-check |
|---|---|---|
| FPI and DII buying, broad index advance | Demand is widely supported | Earnings revisions and valuation |
| FPI selling, DII buying, flat index | Domestic demand is absorbing supply | Breadth and sector leadership |
| Both selling, volatility rising | Liquidity pressure may be spreading | Currency, rates and credit conditions |
Indicator 4: Interest Rates and Liquidity
Interest rates influence the discount rate applied to future cash flows and the relative appeal of equities versus fixed income. Falling rates and improving liquidity can support valuations, while rapid tightening can challenge highly valued or leveraged companies.
The relationship is not mechanical. Rates may fall because growth is weakening, which can hurt earnings. Rates may rise during a strong economy that supports profits. Investors deciding between a bull or bear market interpretation should ask why policy and bond yields are moving.
Watch the RBI policy stance, system liquidity, government bond yields, credit spreads, bank lending conditions and the rupee. A healthy bull market can tolerate moderate rate increases when earnings growth remains strong. Credit stress and scarce liquidity are more concerning.
Liquidity also operates globally. Changes in US yields and the dollar can affect FPI allocation to emerging markets, including India.
Indicator 5: Investor Sentiment and Volatility
Sentiment can be observed through volatility indices, options positioning, fund flows, margin activity, survey data and the behaviour of speculative segments. Low volatility often accompanies a bull market , but extreme calm can signal complacency.
Rising volatility, repeated gap-down moves and demand for downside protection are common in a bear market. Yet volatility usually rises after prices have already weakened, so it is more useful for confirming stress than forecasting an exact peak.
Contrarian signals require care. Optimism can remain high for months, and pessimism can deepen after appearing extreme. Sentiment should be combined with trend and breadth when deciding whether conditions represent a bull or bear market.
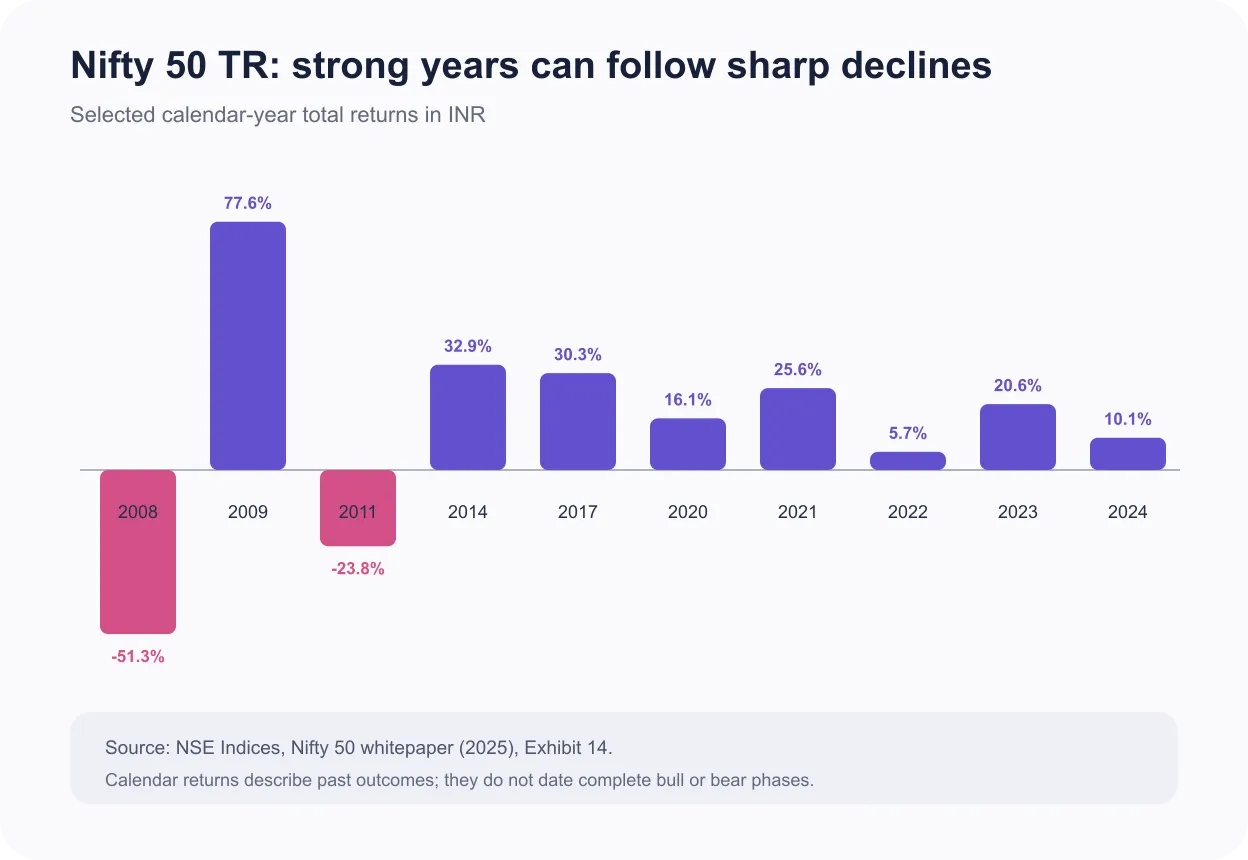
NSE Indices' long-run return history shows why recent emotion can mislead. The Nifty 50 TR fell 51.27% in calendar 2008 and returned 77.59% in 2009. Calendar returns do not define complete cycles, but the reversal demonstrates how rapidly market outcomes can change.
How Bull and Bear Markets Can Affect Your Portfolio
A rising market can increase equity weight above its target and concentrate gains in recent winners. A falling market can expose weak balance sheets, illiquid holdings and risk that looked harmless during easy conditions. The appropriate response begins with portfolio design, not a forecast.
During a bull market , rebalance if equity exposure exceeds the strategic range. Review valuations and diversification, but do not sell solely because prices reached a record. During a bear market , maintain emergency liquidity and distinguish temporary price decline from permanent business impairment.
The bull market vs bear market decision should not produce an all-in or all-out portfolio. Investors can diversify across equity styles, fixed income, gold or other suitable assets, then rebalance using predetermined bands. Wright Research's guide to an all-weather portfolio across Indian market cycles explains this approach.
Review time horizon before acting. Money needed soon should not depend on an equity recovery. Long-horizon capital can tolerate volatility only if the investor avoids forced selling, excessive leverage and concentrated risks.
History can provide context without promising repetition. The guide to Indian stock-market corrections helps separate ordinary drawdowns from deeper stress. A portfolio built for both regimes reduces the pressure to identify every turning point.
The main lesson from bull market vs bear market analysis is humility. Indicators can confirm conditions, but they do not provide certainty or a guaranteed trading signal.
Is your portfolio built for what’s coming?
Get a free AI-powered review of your holdings — risk, overlap and quality in minutes.
FAQ
How do you know if it's a bull or bear market?
Examine the index trend together with market breadth, earnings revisions, valuations, institutional flows, rates, liquidity and volatility. Agreement across several measures is stronger evidence than a single price move.
What are the signs of a bear market?
Persistent lower highs and lows, weak breadth, earnings downgrades, tighter financial conditions, rising volatility and defensive leadership can be warning signs. None is conclusive alone.
How long do bull and bear markets typically last?
There is no fixed duration. A phase can last months or years, and its start and end are usually identified only after prices have moved. Definitions and index choice also affect the dates.
What should investors do in a bear market?
Review asset allocation, liquidity needs and portfolio quality. Rebalance according to a written plan, maintain emergency cash and avoid leveraged or panic-driven decisions.
What factors can signal a shift from a bull to a bear market?
Narrowing breadth, weakening earnings estimates, stretched valuations, tighter liquidity, sustained foreign selling and rising volatility can collectively signal deterioration.
What triggers a bear market?
Possible triggers include recession risk, earnings contraction, inflation or interest-rate shocks, credit stress, geopolitical events and excessive prior valuations. The same event can have different effects depending on positioning and expectations.
When judging a bull or bear market , use several indicators and a consistent horizon. The label is useful only when it improves risk management rather than encouraging emotional market timing.


