


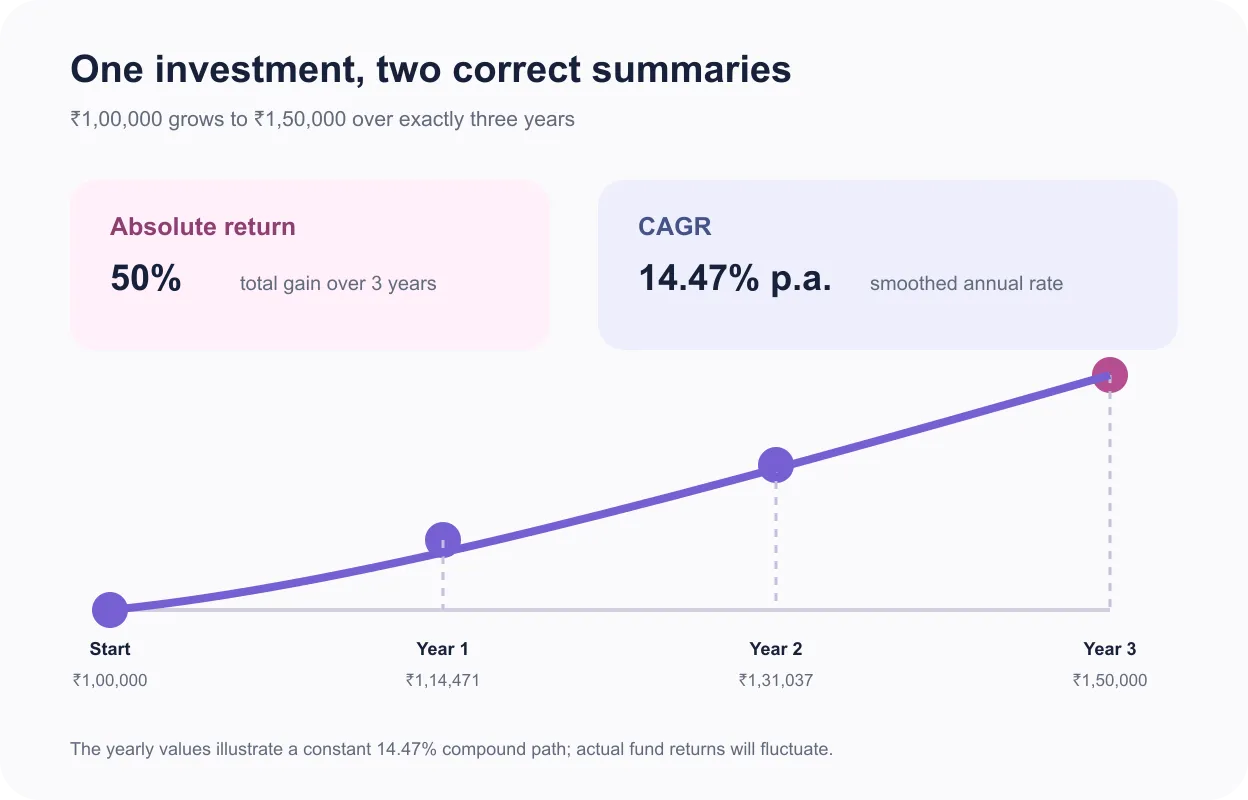
A mutual fund can show a 50% absolute return and a 14.47% CAGR for the same investment without any contradiction. The first number describes the total gain. The second adjusts that gain for a three-year holding period.
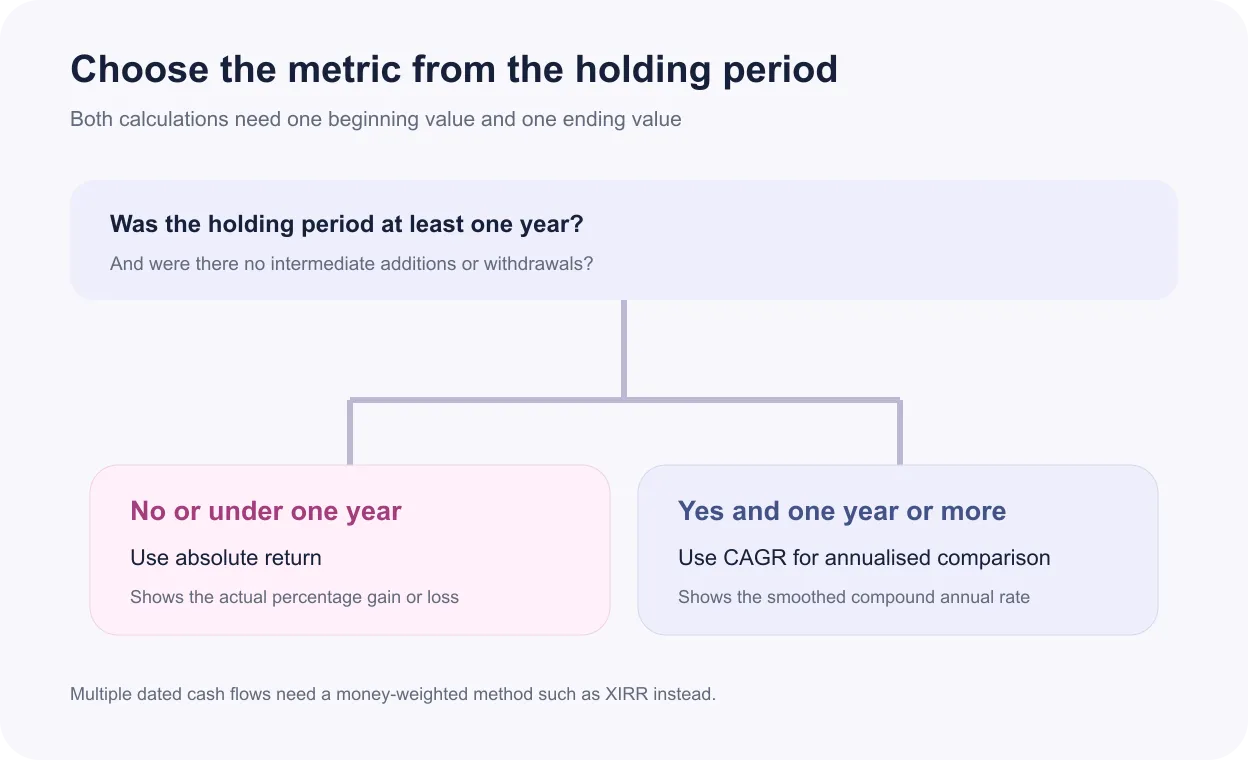
The CAGR vs absolute returns choice depends on time and cash flows. Absolute return is usually clearer for periods below one year. CAGR is more useful for comparing multi-year point-to-point growth when there is one beginning value, one ending value and no intermediate contribution or withdrawal.
What Is CAGR in Mutual Funds?
CAGR in mutual funds means compound annual growth rate. It converts point-to-point growth over more than one year into the constant annual rate that would compound the beginning value into the ending value.
The actual fund does not earn that exact rate each year. One year may be positive and another negative. CAGR smooths the path into one comparable annual figure, which helps when schemes or benchmarks cover the same start and end dates.
SEBI’s performance framework uses compounded annualised returns for longer periods and requires relevant benchmark comparisons. This reinforces an important point: CAGR in mutual funds should be read with the period, plan, option and benchmark, not as a standalone promise.
CAGR also does not reveal sequence. A fund that rises steadily and a fund that falls sharply before recovering can finish with the same beginning value, ending value and CAGR. That distinction matters when an investor may need to redeem during the period. Drawdown and volatility measures are therefore useful companions to the smoothed rate.
See what markets are pricing in
Live indices, sector moves and market breadth — the backdrop to every story we publish.
What Are Absolute Returns?
Absolute return is the total percentage change between a beginning value and an ending value. If ₹1,00,000 becomes ₹1,10,000, the absolute return is 10%, whether that change took three months, one year or five years.
This simplicity makes absolute return useful for a short period. SEBI’s guidance states that returns for periods below one year should be shown in absolute terms rather than annualised. Annualising a brief strong or weak spell can exaggerate its significance.
Absolute return still needs context. The number does not reveal the holding period, volatility, benchmark performance or intermediate drawdown. It also assumes a point-to-point investment without additional cash flows.
The measure works equally for gains and losses. If ₹1,00,000 falls to ₹92,000, the absolute return is −8%. Recovering from that loss requires an 8.70% gain on the reduced value, which is why a loss and an equal percentage gain do not cancel each other mathematically.
CAGR vs Absolute Returns: Key Differences
The central CAGR vs absolute returns distinction is time adjustment. Absolute return reports the total outcome. CAGR reports the equivalent compound annual pace over a stated number of years.
| Feature | CAGR | Absolute return |
|---|---|---|
| What it shows | Smoothed annual compound rate | Total percentage gain or loss |
| Time adjustment | Yes, through the years exponent | No |
| Best use | Point-to-point periods of at least one year | Periods below one year or simple total outcome |
| Inputs | Beginning value, ending value and years | Beginning value and ending value |
| Intermediate cash flows | Not handled | Not handled |
| Main risk | Smoothing hides volatility | Missing period can mislead |
For a fair CAGR vs absolute returns comparison, align the dates and confirm whether distributions are reinvested. If money entered or left during the period, neither formula properly measures the investor experience; a dated cash-flow method such as XIRR may be required.
How to Calculate CAGR: Formula and Example
To understand how to calculate CAGR, use: CAGR = (Ending value ÷ Beginning value)1/n − 1, where n is the holding period in years. Multiply the decimal result by 100.
Suppose ₹1,00,000 becomes ₹1,50,000 in exactly three years. The calculation is (1.5)1/3 − 1 = 0.1447, or 14.47% a year. The 50% total gain is being expressed as an equivalent three-year compound rate.
When checking how to calculate CAGR for partial years, use a precise year fraction based on elapsed days when the tool supports it. Do not round eighteen months to one year or two years, because the exponent materially affects the answer.
Get research like this in your inbox
The week’s research that mattered, in five minutes. Joined by 2L+ investors.
How to Calculate Absolute Returns: Formula and Example
To understand how to calculate absolute returns, use: Absolute return = [(Ending value − Beginning value) ÷ Beginning value] × 100. No annualisation exponent is applied.
Using the same example, (₹1,50,000 − ₹1,00,000) ÷ ₹1,00,000 × 100 = 50%. Both 50% absolute return and 14.47% CAGR are correct; they answer different questions.
For an accurate mutual fund return calculation, use adjusted values when a distribution or corporate action changes the economic outcome. Ensure the beginning and ending values refer to the same plan and option.
When Should You Use CAGR Over Absolute Returns?
Use CAGR for multi-year point-to-point comparison. It helps compare a three-year fund return with another three-year fund or benchmark return on a common annualised basis. Use absolute return when the period is below one year or when the total gain itself is the relevant question.
A practical CAGR vs absolute returns rule is to show both for a long holding when clarity matters: total wealth created and annualised pace. SEBI has historically required a ₹10,000 point-to-point illustration alongside CAGR in scheme performance communication to improve retail understanding.
The CAGR vs absolute returns decision should also match the purpose. CAGR supports comparisons across investments with different multi-year lengths. Absolute return communicates what happened to the original capital over the actual period. Neither figure incorporates inflation, tax or investor-specific cash flows unless those effects are built into the values used.
Investors evaluating CAGR in mutual funds should also compare category, benchmark, expenses and risk. A higher CAGR can accompany deeper drawdowns or concentration, and past performance may not persist.
Common Mistakes While Comparing Fund Returns
The first mistake is comparing an absolute return for one period with a CAGR for another. The second is ignoring plan and option differences. Direct and regular plans have different expenses, while cash distributions change the return path.
Another error is using a CAGR vs absolute returns calculation for SIPs. Multiple contributions have different holding periods, so one beginning value and one ending value are insufficient. Use XIRR with signed cash flows and actual dates.
Investors may also treat CAGR as a forecast or infer a smooth journey. A complete mutual fund return calculation should identify the dates, cash-flow assumptions, benchmark and whether the figure is absolute or annualised. Then review volatility, drawdown and consistency before drawing a conclusion.
Keep the source statement and calculation date with the result. Recomputing from rounded dashboard figures can produce small differences from an AMC's published return.
Finally, avoid comparing a scheme’s growth-option return with an investor statement that includes purchases, withdrawals or cash distributions. Scheme performance and investor performance can legitimately differ. Reconcile units, NAV dates and distributions first, and use a total-return benchmark over the same interval.
Is your portfolio built for what’s coming?
Get a free AI-powered review of your holdings — risk, overlap and quality in minutes.
FAQ
What is the difference between CAGR and absolute returns?
Absolute return shows the total percentage gain or loss from the beginning value to the ending value. CAGR converts that same point-to-point change into a smoothed compound annual rate over the holding period.
How do you calculate CAGR in mutual funds?
Divide the ending value by the beginning value, raise the result to 1 divided by the holding period in years, and subtract 1. Multiply by 100 to express the CAGR as a percentage.
How do you calculate absolute returns?
Subtract the beginning value from the ending value, divide the result by the beginning value and multiply by 100. This gives the total percentage return for the complete period.
When should you use CAGR instead of absolute returns?
Use CAGR for point-to-point comparisons lasting at least one year when there are no intermediate cash flows. For periods below one year, absolute return is generally clearer and avoids misleading annualisation.
Can absolute returns be misleading?
Yes, if the holding period is omitted. A 20% return over six months and a 20% return over five years have the same absolute figure but very different time-adjusted outcomes.
Is CAGR the same as annualised return?
CAGR is a type of annualised return based on compound growth between a beginning and ending value. Other annualised methods exist, so investors should verify the calculation and cash-flow assumptions.


