


Promoter ownership can reveal who controls a company and how much capital remains invested alongside public shareholders. It cannot, by itself, establish business quality. A concentrated owner may think long term, but the same control can reduce liquidity or weaken minority-shareholder influence. This is why high promoter holding stocks should be screened with pledging, governance, financial performance and valuation.
This guide uses shareholding patterns for the quarter ended 30 September 2026. The company list is illustrative, dated and not a recommendation. Holdings can change after open-market transactions, offers for sale, preferential issues, mergers or reclassification.
What Are High Promoter Holding Stocks?
Promoters are the people or entities identified as having founded the company, controlling it or exercising significant influence, together with the disclosed promoter group. High promoter holding stocks are listed companies in which this category owns a large percentage of equity. In many private-sector companies, a stake near 75% is close to the practical upper end because listed companies generally need to maintain minimum public shareholding, subject to applicable rules and exceptions.
Promoter ownership is not the same as management ownership. A professional chief executive may hold few shares, while the promoter family controls the board through a holding company. It is also not the same as total insider ownership, which can include directors or executives classified outside the promoter group.
A high promoter holding share can signal commitment and stable control, but the interpretation depends on the route used to build the stake, changes over time and whether shares have been pledged. The percentage should be treated as an ownership fact, not a quality score.
See what markets are pricing in
Live indices, sector moves and market breadth — the backdrop to every story we publish.
High Promoter Holding Stocks in India: Comparison Table
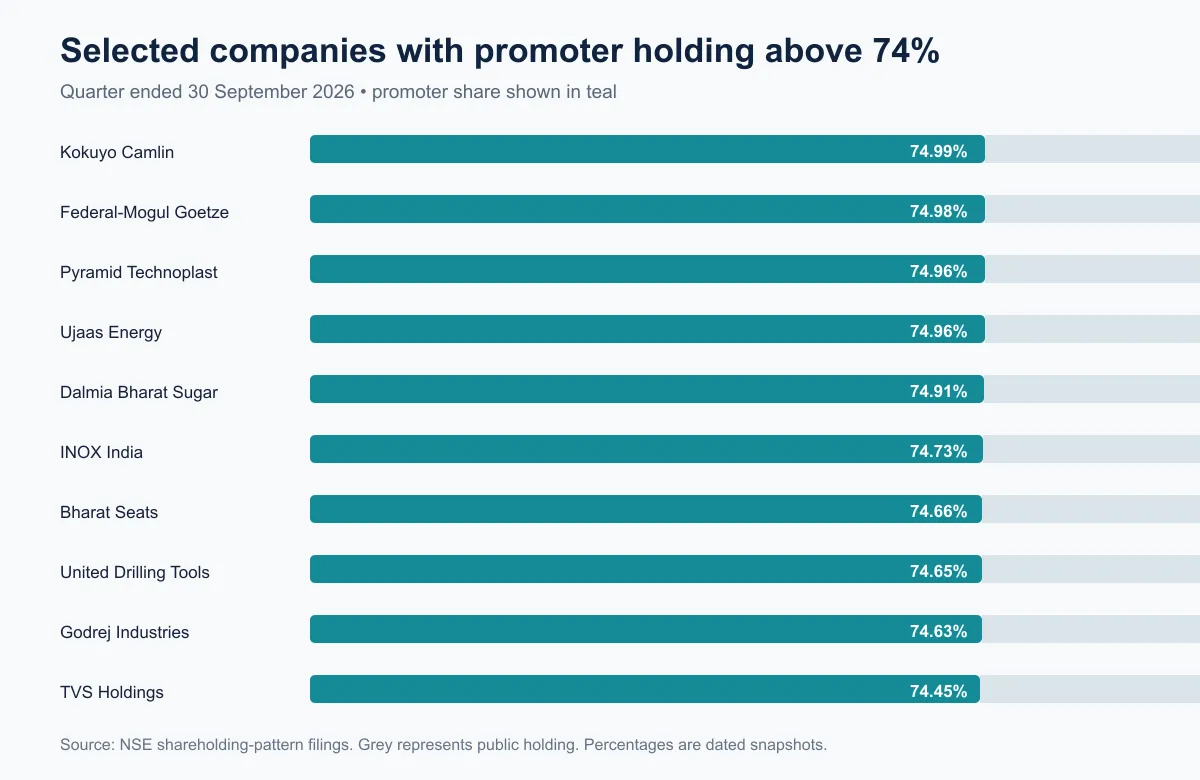
The table shows selected NSE-listed companies with promoter stakes above 74% in their shareholding patterns for 30 September 2026. It deliberately spans several industries. Public holding is the exchange-reported non-promoter percentage in the cited filing summary. Investors should open the underlying filing to inspect individual promoter entities and encumbrances.
| Company | Industry context | Promoter and promoter group | Public holding | Research note |
|---|---|---|---|---|
| Kokuyo Camlin | Stationery and art materials | 74.99% | 25.01% | Check parent-group control and related-party transactions |
| Federal-Mogul Goetze (India) | Automotive components | 74.98% | 25.02% | Compare parent support with minority-shareholder treatment |
| Pyramid Technoplast | Industrial packaging | 74.96% | 25.04% | Review customer concentration and working capital |
| Ujaas Energy | Renewable-energy equipment and projects | 74.96% | 25.04% | Examine restructuring history and cash-flow quality |
| Dalmia Bharat Sugar and Industries | Sugar, ethanol and power | 74.91% | 25.09% | Account for commodity cycles and policy sensitivity |
| INOX India | Cryogenic equipment | 74.73% | 25.27% | Track order book, execution and export mix |
| Bharat Seats | Automotive seating | 74.66% | 25.34% | Check customer dependence and related-party exposure |
| United Drilling Tools | Oilfield equipment | 74.65% | 25.35% | Review order volatility and receivable collection |
| Godrej Industries | Holding company and diversified interests | 74.63% | 25.37% | Use a sum-of-the-parts view and holding-company discount |
| TVS Holdings | Investment and automotive group interests | 74.45% | 25.55% | Separate operating value from investment holdings |
These are examples of stocks with high promoter holding, not a ranking of expected returns. The tiny difference between 74.99% and 74.45% has little analytical value. Balance-sheet strength, cash generation and governance matter far more. Use the Wright Research stocks platform to continue company-level research after verifying the latest filing.
How to Read Quarterly Shareholding Patterns
Listed companies disclose shareholding patterns after each quarter. Begin with the reporting date, because a pattern published in October may describe ownership at 30 September. Then compare promoter and promoter-group ownership with the previous four quarters. A stable percentage can indicate continuity; an increase or decrease requires an explanation.
Open the detailed filing rather than relying only on an aggregator. Identify every promoter entity, shares held in dematerialised form, voting rights and any shares pledged or otherwise encumbered. Also review whether warrants, convertible securities, employee options or a pending issue could dilute the percentage.
Absolute share count matters alongside percentage. A promoter's percentage can fall even without a sale when the company issues new shares. Conversely, a buyback can raise the percentage without a promoter purchase. Good analysis of promoter shareholding reconciles the percentage movement with changes in total equity.
Promoter Holding vs Public Float and Institutional Ownership
Public float broadly represents shares available outside the promoter category, but not every public share trades frequently. Strategic investors, institutions and long-term holders may keep large positions. The effective free float can therefore be smaller than the reported public percentage.
Within public ownership, examine mutual funds, foreign portfolio investors, insurance companies, bodies corporate and retail shareholders. Rising institutional ownership may reflect improving research coverage, but it is not automatically positive. A concentrated institutional exit can also pressure a thinly traded stock.
Shares with high promoter holding often have lower free float. This can increase the price impact of modest orders, widen bid-ask spreads and make reported market capitalisation a poor proxy for readily tradable value. Compare delivery volumes, median daily traded value and impact cost before assuming that an apparent position can be entered or exited easily.
Potential Benefits: Long-Term Ownership and Strategic Control
Substantial promoter capital can align wealth with the company's long-term outcome. Controlling owners may be more willing to fund capacity, protect a brand or tolerate a temporary earnings decline when a project has a sound multi-year case. Stable control can also support faster strategic decisions.
Family or group knowledge may be valuable in specialised manufacturing, distribution and regulated industries. An owner with reputation and capital at risk has an incentive to protect the franchise. These are plausible benefits of high promoter holding stocks, not guarantees.
Alignment works only when value is shared fairly. Review dividends, buybacks, mergers, related-party purchases, remuneration and preferential allotments. A promoter can be economically committed while still making decisions that disadvantage minority investors. The board's independence and disclosure quality therefore remain essential.
Get research like this in your inbox
The week’s research that mattered, in five minutes. Joined by 2L+ investors.
Warning Signs: Pledged Shares, Falling Stake and Governance
A pledge allows promoter shares to secure borrowing. If collateral value falls, the lender may demand more security or sell shares, potentially reinforcing price declines. Record pledged shares both as a percentage of promoter holding and of total equity. A low promoter stake with heavy pledging can carry different risk from a 75% stake with no encumbrance.
Falling ownership needs context. A sale may fund personal diversification, meet public-shareholding requirements or improve liquidity. It may also signal reduced conviction or financial stress. Repeated sales combined with pledging, weak cash flow or opaque related-party transactions deserve greater caution.
Other warning signs include frequent auditor changes, delayed filings, unexplained loans to group entities, guarantees unrelated to the core business, preferential issues on questionable terms and promoter remuneration rising faster than profits. High promoter holding stocks do not neutralise these risks. In fact, concentrated voting control can make independent oversight more important.
How Promoter Ownership Can Affect Liquidity and Price Movement
If promoters hold 75%, only 25% is classified as public. Long-term institutional stakes can reduce the actively traded portion further. A small market order may then move the price more than it would in a company with broad ownership. This works in both directions and can produce sharp rallies as well as rapid declines.
Low float can also create misleading valuation signals. The last traded price values every share, even though only a small fraction may have changed hands. Screen average daily traded value in rupees, number of trades, delivery percentage and bid-ask spread. Use several months rather than one unusually active session.
For stocks with high promoter holding, position sizing should reflect exit liquidity. Avoid assuming that a stop-loss or market order will execute near the displayed price during stress. Liquidity risk is separate from business risk and can persist even when reported results are strong.
Combine Promoter Data With Fundamentals and Valuation
Ownership is one input in fundamental analysis. Pair it with revenue quality, operating margins, return on capital, leverage, working-capital discipline and free cash flow. A company can have stable owners but destroy value through poor reinvestment. Another may have moderate promoter ownership and excellent governance.
Read the cash-flow statement and notes to accounts for related-party transactions, guarantees, contingent liabilities and capital advances. The Wright Research guide to fundamental analysis in the stock market provides a broader framework for connecting these disclosures.
Valuation must reflect control and liquidity risks. Compare the company with peers using earnings, cash flow, enterprise value and return on capital, then ask whether the premium for ownership stability is justified. A portfolio view also matters: use the Wright Research portfolio tools to identify concentration across promoter groups, industries and risk factors.
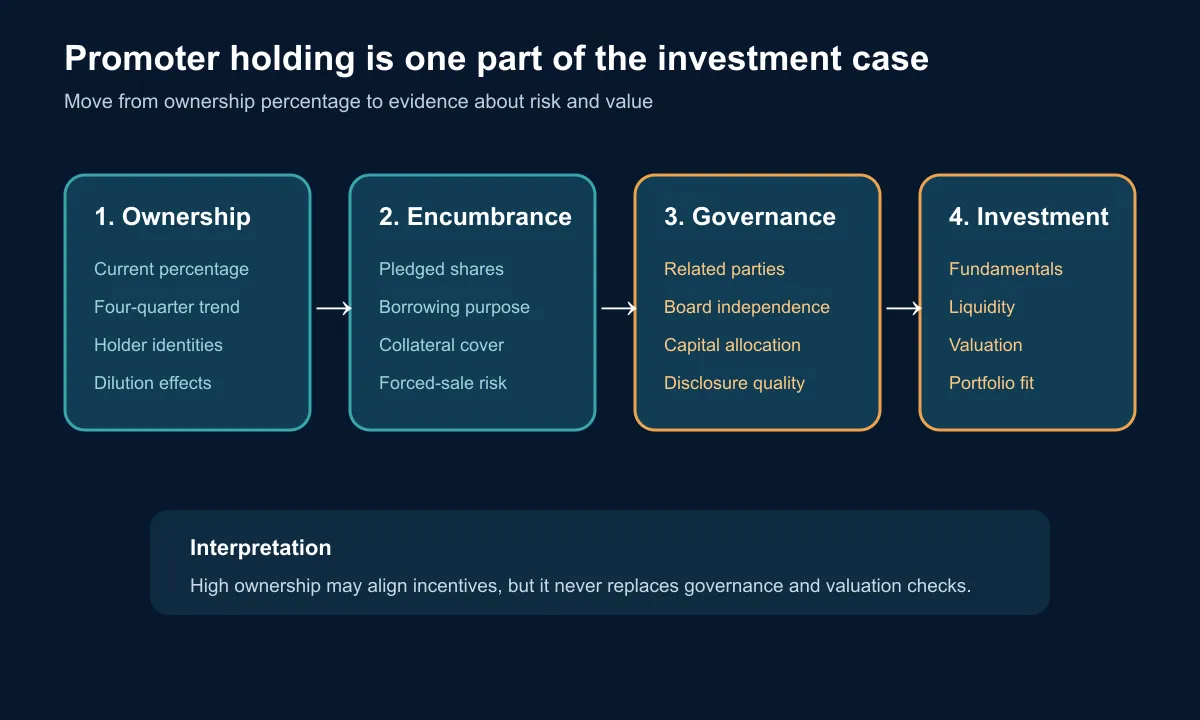
The best shares with high promoter holding are not necessarily those closest to 75%. They are companies where ownership, governance, financial quality and price collectively support the investment case.
Screening Rules and Data Date for the 2026 List
This article used a simple, reproducible screen:
- Start with NSE-listed equity companies whose 30 September 2026 filing showed promoter ownership above 74%.
- Exclude the idea that percentage alone ranks quality; select examples across industries.
- Verify promoter and public percentages against the exchange filing summary.
- Open the detailed filing to assess promoter entities and encumbrance disclosures.
- Review at least four prior quarters for sales, dilution or reclassification.
- Add liquidity, governance, debt, cash-flow and valuation checks before considering suitability.
The data date matters because promoter shareholding is a quarterly snapshot. Refresh the screen after the next filing cycle and after any material equity issue or promoter transaction. The phrase high promoter holding share should never substitute for a dated percentage and filing source.
Following this process keeps concentrated ownership in context. It also prevents a mechanical screener from turning an ownership characteristic into an unsupported recommendation.
Is your portfolio built for what’s coming?
Get a free AI-powered review of your holdings — risk, overlap and quality in minutes.
FAQ
Can promoter shareholding exceed 75% in an Indian listed company?
It can occur under applicable exceptions, transition periods or special cases, including some government-controlled or newly listed entities. For many listed private companies, minimum public-shareholding rules generally make 25% public ownership the continuing benchmark. Verify the rule and deadline applying to the specific company.
Do shares held by promoter-group entities count toward promoter holding?
Yes. The disclosed promoter and promoter-group total includes the persons and entities classified in those categories under the applicable regulations. The detailed filing identifies each holder and its stake.
What is the difference between promoter holding and insider ownership?
Promoter holding is a formal disclosure category tied to control and promoter classification. Insider ownership is a broader informal term that may include directors, executives or connected persons who are not classified as promoters.
Can promoters increase their stake through open-market purchases?
Yes, subject to takeover regulations, minimum public-shareholding requirements, trading-window restrictions and disclosure obligations. The permitted route and quantity depend on the existing stake and transaction circumstances.
High promoter holding stocks can combine stable control with long-term ownership, but they can also carry liquidity, pledging and governance risks. Use the shareholding pattern as the start of research, then test the business and valuation independently.
For education only, not investment advice. Shareholding data changes with quarterly filings and corporate actions. Consult a SEBI-registered investment adviser where appropriate.


