

On 14 August 2026, the CBOE Volatility Index closed at 14.25, its lowest level of the year, with the S&P 500 sitting within 0.2% of a record. Six days later India VIX traded at 10.69. Both readings arrived in a year that opened with war between the United States, Israel and Iran, disruption around the Strait of Hormuz, an energy shock, and the largest foreign outflow from Indian equities on record. The Geopolitical Risk Index reached its highest level in almost 25 years. Measured volatility moved the other way.
This article looks at what produces it, why the world underneath is shifting from stable averages toward wider distributions - standard deviations, and what that means for global markets, the Indian economy and Indian equities.
What is the volatility paradox?
Low measured volatility changes behaviour. Investors extend leverage, size positions off recent variance and sell options for income. Companies trim inventory and consolidate suppliers because the risk premium looks unnecessary. Each decision is rational at the level of the individual firm or fund, and together they remove the slack the system uses to absorb a shock. The reading that reports calm is part of what manufactures the next disturbance. Regulators have described this since at least 2017, when the US Office of Financial Research warned that tranquil markets can harbour hidden risks.
The 2026 version is visible inside a single options chain. 30 day realised volatility on the S&P 500 sat near 13.3% in mid-August, so the calm was real. 1 month implied correlation fell to 9.5 while dispersion reached 42.5, meaning large moves in individual stocks were cancelling each other out inside the index. At the same time, deep downside protection stayed in the 66th percentile of its 5 year range, and VIX futures for September and December traded at 17.92 and 20.38. The market priced quiet now and turbulence later.
Check the macro backdrop
GDP, inflation, rates and more — India’s key economic indicators in one dashboard.
Why is the world moving from averages to standard deviation?
Olivier Hamant, a biologist at the École Normale Supérieure de Lyon who directs the Institut Michel Serres, compresses the shift into one line. The world is leaving the era of the means, averages and entering the era of the standard deviations. Ecological overshoot removes buffers. A system with fewer buffers produces a more turbulent climate and thinner ecosystem services. The first-order consequence is that conditions become harder to predict. Averages continue to move, and they move slowly. Variance moves faster, and variance is what breaks things.
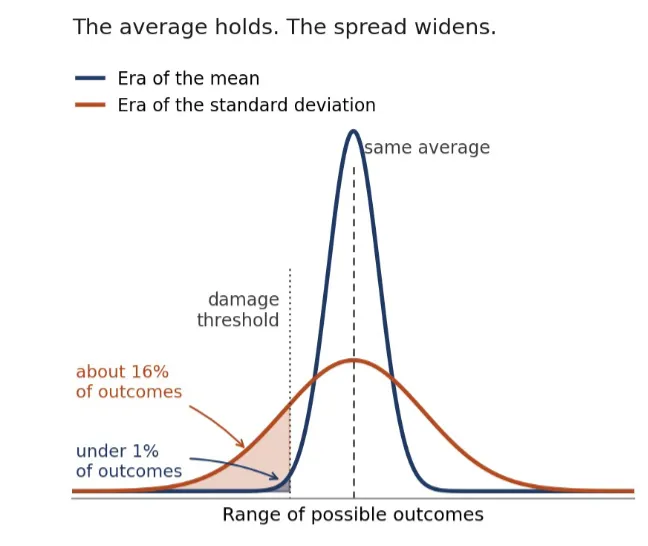
The same description now fits the economic environment. Energy prices, shipping routes, tariff schedules, policy rates and input availability all move inside ranges wider than the ones most institutions were designed around.
The distinction that does the work
Hamant separates performance, which he defines as efficacy plus efficiency, from robustness, which he defines as remaining stable and viable despite fluctuation. His example is a tree in the wind. It stays stable while it moves, and it stays viable through drought and freezing temperatures, so its space of viability is wide. The two properties trade against each other. A shark has persisted for hundreds of millions of years while being inefficient. An orchid co-evolved with a single pollinator is finely optimised and correspondingly exposed.
He also explains why the performance orientation was affordable. Cheap and abundant energy acted as a societal safety net, which made competition and optimisation survivable at scale. As that net becomes thinner, the replacement comes from interactions rather than from more resources: diversity, redundancy and cooperation. A system that is both complex and tightly interdependent will produce a failure eventually, as a property of its design.
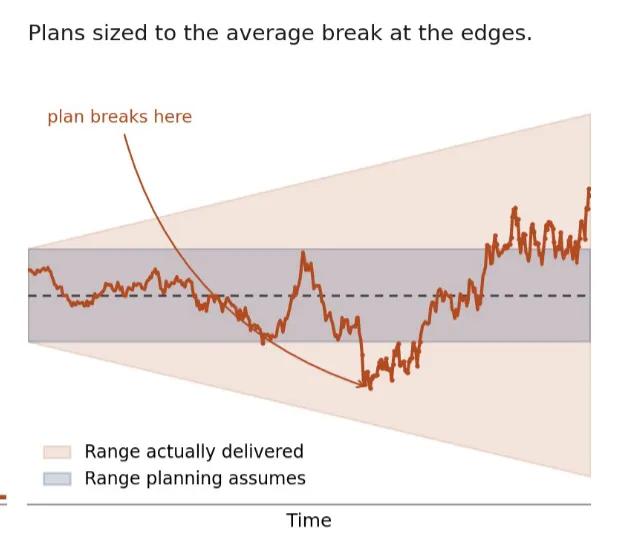
His clearest illustration involves the sea. Planning against the mean produces a dike sized to the average rate of sea level rise. Planning against the standard deviation assumes a submersion event could arrive next year and produces housing built to let water in and out. Markets make this choice continuously.
Robustness and resilience describe different achievements
Resilience means falling and recovering. Antifragility means falling and recovering higher. Both require the fall. Robustness means arranging conditions so the fall does not happen, and it describes a space of viability rather than a path through one. Inside that space a system can rise, decline or oscillate and stay viable.
In the Indian case, calling the economy resilient after a quarter of conflict and commodity disruption is a statement about recovery. Holding 11 months of import cover before the conflict began is a statement about the space. The second is what made the first available.
Every buffer is idle capital. Every second supplier costs a volume discount. Every month of inventory is working capital doing nothing. In a world described by its average, those are inefficiencies to be removed. In a world described by its spread, they are the mechanism through which a system survives a bad draw. Once a measure becomes a target, it stops being a reliable measure, which is precisely what happens when volatility indices become inputs to position sizing.
For instance, adding two-factor authentication to a banking login raises the level of control and lowers the user's vigilance, which makes a convincing impersonator more likely to succeed. Raising control raised insecurity. The volatility paradox is that mechanism running inside a market, where the instrument reporting safety changes behaviour in the direction of danger.
What does this look like in the global economy?
In April 2026 the IMF declined to publish a single number for the year. Its reference case put global growth at 3.1%, an adverse scenario at 2.5% and a severe scenario at 2.0%. A spread of 1.1 percentage points for the 12 months.
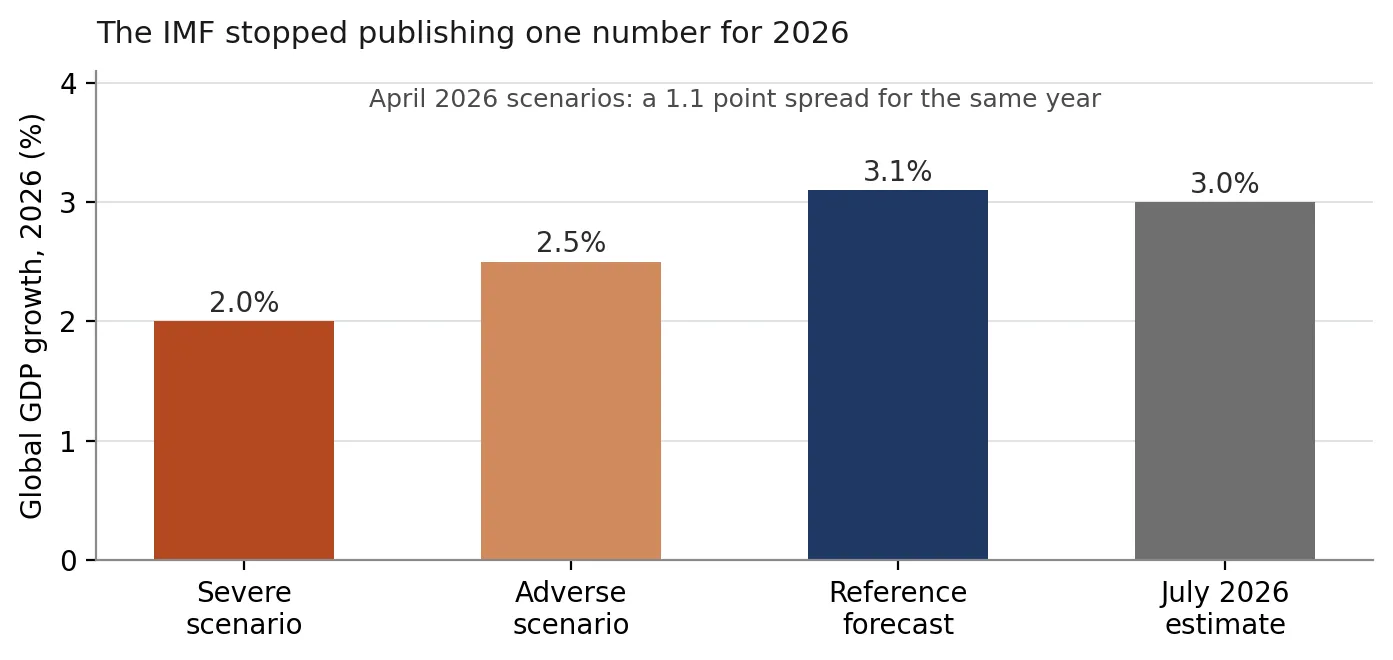
The July update settled on 3.0% for 2026 and 3.4% for 2027, with headline inflation revised up to 4.7% and global trade growth slowing to 3.5% from 5% in 2025. The reason the outcome landed near the top of the April range is instructive. The IMF attributed it to inventory drawdowns, oil output outside the Gulf, demand management measures, a higher share of renewables and lower energy intensity. Every one of those is a buffer, a redundancy or a diversification. The shock was absorbed by the slack that efficiency logic treats as cost.
Firms have learned this unevenly. In one 2026 survey of 250 retail supply chain leaders, 87% were raising buffer inventory and 77% had shifted sourcing away from China. McKinsey found close to half of supply chain leaders planning to cut or eliminate risk buffers instead.
Two ways to run a system
Dimension | Performance logic | Robustness logic | A 2026 data point |
|---|---|---|---|
Inventory | Minimise working capital | Hold buffer stock | 87% of surveyed retail supply chain leaders raised buffers |
Sourcing | Single supplier for scale | Multiple suppliers across regions | 77% shifted sourcing away from China |
Reserves | Deploy idle capital | Hold large, diversified reserves | India holds about 11 months of import cover |
Ownership | Concentrate where returns are highest | Spread across uncorrelated holders | Domestic funds absorbed record foreign selling in India |
Forecasting | Publish one central estimate | Publish a range of outcomes | The IMF issued three growth scenarios for 2026 |
How is capital behaving inside the paradox?
Goldman Sachs titled its mid-year outlook Embracing the Volatility Paradox. Announced global M&A reached $3.1 trillion in the first half of 2026, up 48% year on year and above the $2.9 trillion peak of the first half of 2021. Deal size drove the increase, with mega deal volumes up 125%. In a survey of about 500 corporate and sponsor clients run between 15 June and 6 July, nearly half said current conditions made them more willing to transact and 58% named scale and strategic growth as their primary driver. The bank's head of global M&A described boardrooms treating inaction as the ultimate risk.
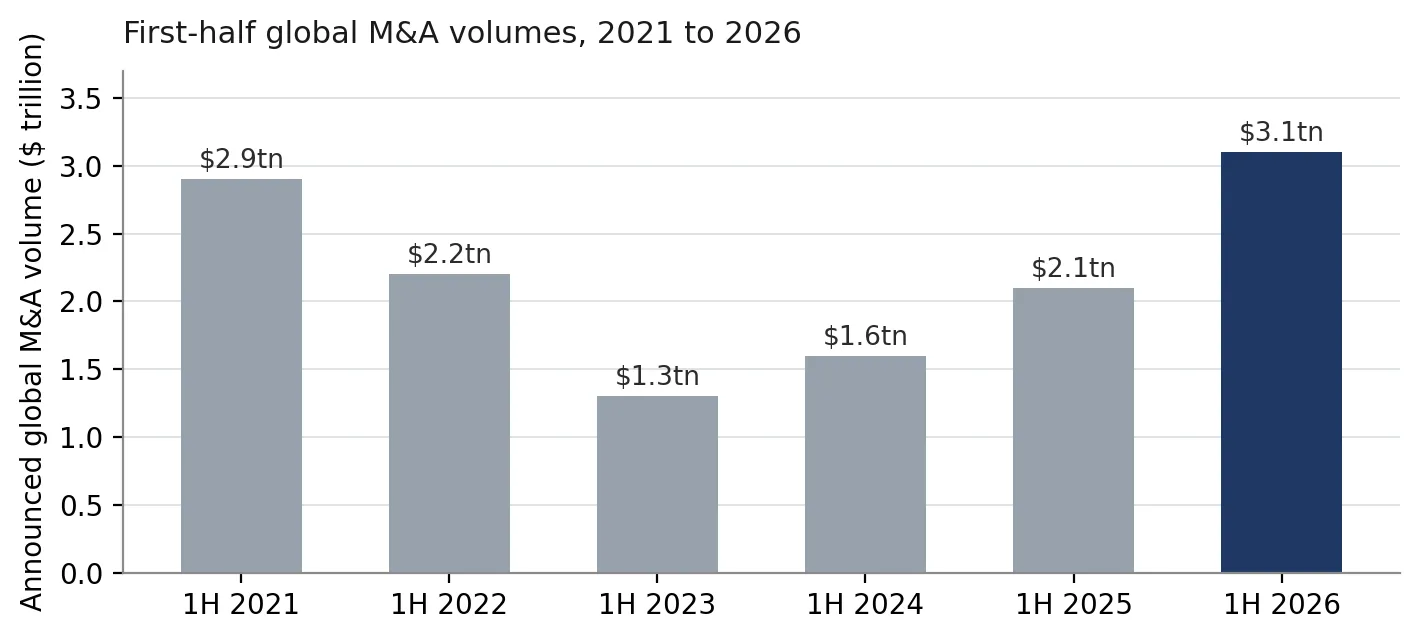
Goldman also names the valuation regime underneath it, calling it the tyranny of terminal value, where an asset's distant future worth sets its price today. That pushes more of every valuation into the part of the distribution nobody can observe. The direction of that capital matters more than its volume. Buyers are consolidating for scale, concentrating on core markets and separating everything else, with global separation activity up 145% against its 2021 to 2025 average. Goldman's own description of the environment is that volatility has become the standard operating condition. The response to it has been concentration, which is a performance answer to a robustness problem. One part of the wave runs the other way: cross-border activity has strengthened partly because companies are buying supply chain diversification and access to critical technologies, which is redundancy purchased through a transaction.
The exit backlog shows where the slack went
Distributions to limited partners sit near levels last seen after the financial crisis, and general partners hold roughly 16,000 companies owned for more than four years, over half of all buyout-backed inventory. Liquidity is the buffer in private markets, and continuation vehicles have become mainstream because the ordinary exit route narrowed. A system optimised to hold assets longer at higher valuations has less room to absorb a repricing.
Public markets carry the same shape. The 10 largest companies in the S&P 500 account for roughly 40% of the index by market capitalisation, above the 27% reached at the peak of the dot-com period, and passive vehicles hold more than half of US equity assets under management. 3 hyperscalers account for around 70% of consensus earnings growth expectations for the index in 2026. Passive allocation is a mean-seeking rule, sending each incremental rupee or dollar toward whatever is already largest, and it now sets prices in a market whose returns are determined by the tails. Index-level calm is partly a product of this structure, because winners and losers inside a narrow theme offset each other day to day. If the thesis reprices, correlation converges toward one, the condition under which volatility rises fastest and stays elevated longest.
Get research like this in your inbox
The week’s research that mattered, in five minutes. Joined by 2L+ investors.
Why has the Indian economy absorbed shocks better than expected?
Real GDP grew 7.8% in the April to June quarter of FY27, above the Reserve Bank's 7% projection and a consensus near 7.1%. Manufacturing grew 9.2% and services 10%, while real gross fixed capital formation rose 11.9%. Chief Economic Adviser V. Anantha Nageswaran described the economy as having weathered global uncertainties rather well, pointing to merchandise exports excluding oil, gems and jewellery, private consumption and a visible pickup in private capital formation.
Foreign exchange reserves stood at about $691 billion at end-March 2026, covering roughly 11 months of imports and 90.3% of external debt. Reserves had touched a record $728.5 billion in February and fell as the RBI sold dollars to keep the rupee's slide toward 94 orderly. Trade arrangements widened at the same time, with the United Kingdom agreement operational, the Israel investment agreement in force and the European Union agreement expected before the end of the calendar year.
None of that raised the growth rate. All of it widened the range of outcomes the economy could survive. That is the trade robustness asks for.
What explains the resilience of Indian equities in 2026?
Foreign portfolio investors sold Indian equities worth about ₹2.8 trillion between January and early June 2026, the largest first-half outflow on record. Domestic institutional investors bought ₹4.3 trillion over the same period, close to ₹4,000 crore every trading session. In March, the month the Nifty fell 9.37% during the Iran conflict, foreign selling of ₹1.18 trillion met domestic buying of ₹1.36 trillion.
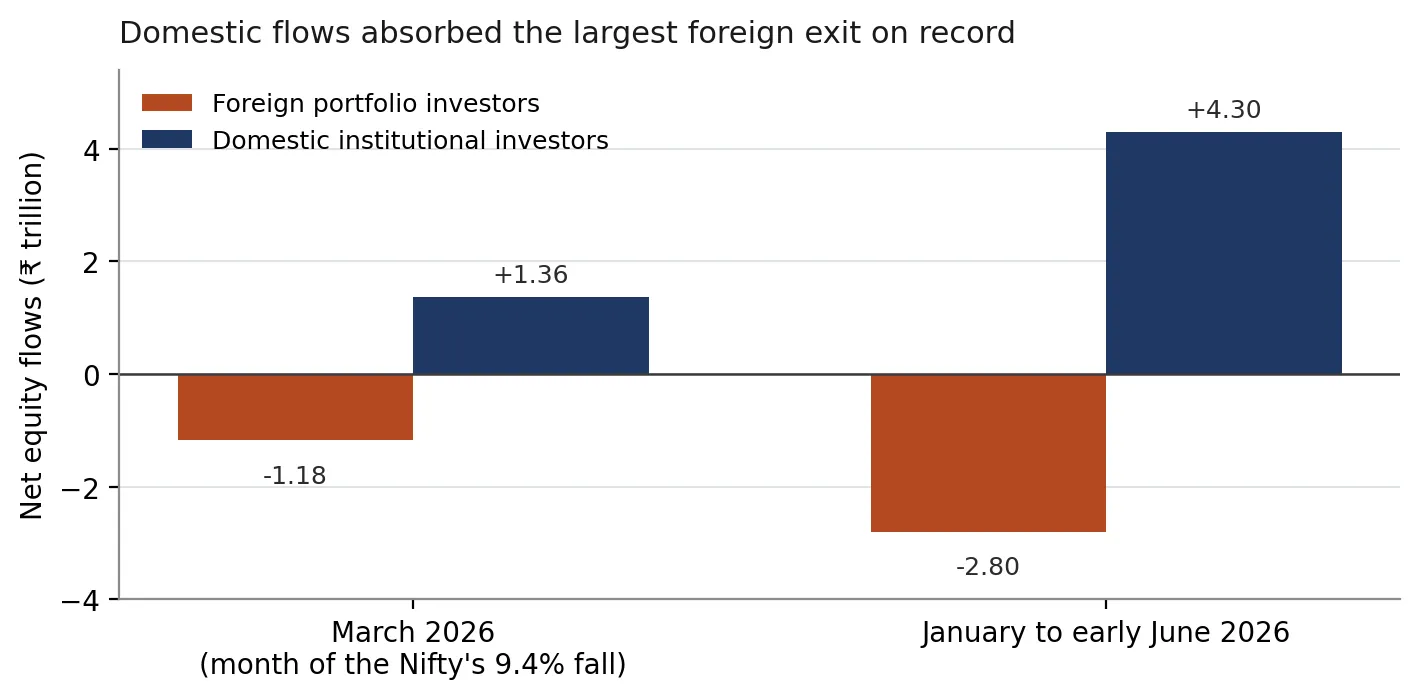
The mechanism is more important than the totals. Systematic investment plan contributions reached a record ₹32,087 crore in March 2026 and arrive on a schedule with no relationship to the market level. Equity mutual funds have recorded net inflows for 61 consecutive months, and foreign ownership fell below domestic institutional ownership for the first time. A decade ago, foreign selling moved prices, which triggered risk limits at other foreign desks, which produced more selling. A heterogeneous holder base breaks that loop. India VIX peaked at 28.91 during the West Asia conflict and traded at 10.69 by 20 August.
The last fifteen minutes show the other side of the trade
India replaced its volume-weighted average closing price with a closing auction session for futures and options stocks in August 2026, running from 3:15 to 3:35 PM. The design goal was a single fair and transparent closing price. The result has been sharp swings in the final minutes, including a fall of more than 400 points in the Sensex between 3:25 and 3:30 PM on 3 September, differing index closes across the two exchanges, and thin participation. Jefferies reported that average daily options turnover fell 20% month on month in August. Optimising one variable concentrated price discovery into a window with less liquidity inside it.
The participants show a similar pattern. SEBI's studies published on 20 August 2026 found that 87.7% of individual equity derivatives traders lost money in FY26, with aggregate net losses of ₹91,685 crore, about 92% of it from options. Active individual traders fell 20% to 78.6 lakh and new entrants dropped roughly 40%. Around 99% of the profits earned by proprietary desks and foreign investors came from algorithmic entities. A market optimised for speed and volume transfers money toward whoever is fastest.
Absorber | Measure | Reading |
|---|---|---|
Domestic equity flows | DII net purchases, January to early June 2026 | ₹4.3 trillion |
Retail commitment | Monthly SIP contribution, March 2026 | ₹32,087 crore, a record |
External buffer | Foreign exchange reserves, end-March 2026 | $691 billion, about 11 months of imports |
Reserve diversification | Gold share of total reserves | Up from 13.9% to 16.7% |
Trade arrangements | Agreements operational or in force | United Kingdom, Israel, EU expected by end-2026 |
Fiscal room | Asset monetisation receipts | 84% of the full-year target |
Does robustness actually pay in Indian equities?
The trade has been measured. A study sorted Nifty 200 constituents into deciles by trailing 3 year volatility and rebalanced monthly across 138 months from January 2004 to June 2015. The least volatile decile earned 11.40% a year in excess of the risk-free rate. The most volatile decile earned 1.30%. The equal-weighted universe earned 6.89%. On a risk-adjusted basis the gap widens, with Sharpe ratios of 0.64 and 0.03, and it holds after controlling for size, value and momentum. Ex-post beta was 0.51 for the low volatility decile against 1.45 for the high volatility decile, an alpha spread of 16.63%.
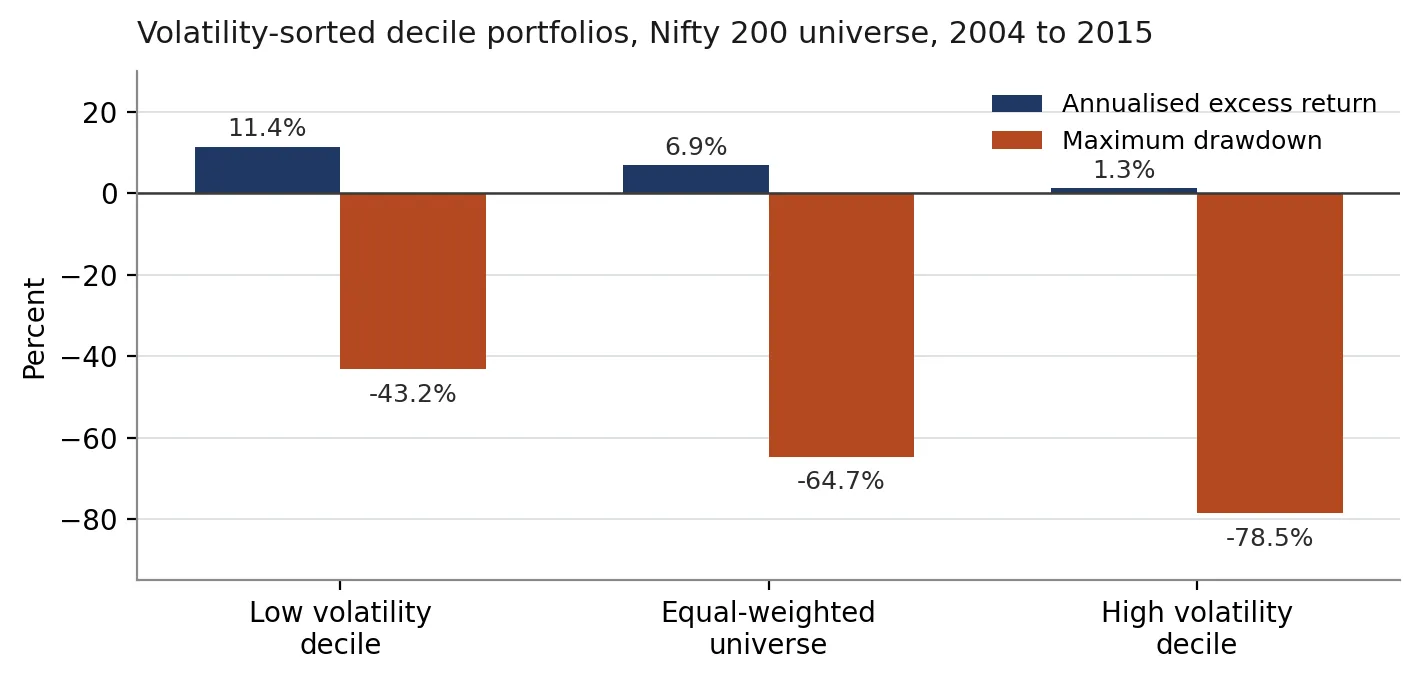
The low volatility decile underperformed the universe by 2.16% in rising months and outperformed by 4.09% in falling ones. The sample contained 82 up months against 58 down months, so the portfolio gave up ground more often than it gained it and still finished ahead. Maximum drawdown was 43.2% for the low volatility decile, against 64.7% for the universe and 78.5% for the high volatility decile. Accepting a worse ordinary day in exchange for a survivable bad one compounds better across a full cycle. The authors are careful about one limit. Once beta is controlled for directly, the effect weakens and loses statistical significance, which suggests much of what reads as a volatility premium is a beta premium. The practical conclusion holds either way.
The authors' explanation for why the gap persists runs through incentives. Institutional mandates are benchmarked, borrowing is constrained, and investors chase recent performance, which pushes managers toward high beta names and toward caring about outperformance in rising markets. Robustness stays available at a discount because the industry is paid on one half of the distribution.
What should be measured instead of volatility?
Volatility indices describe what the market expects over the next 30 days. They say little about what happens when that expectation is wrong, which is the case that matters.
How many months of buffer exist for the inputs that have no substitute? What share of a portfolio's return depends on a single thesis continuing to hold? What happens to a position if correlation across holdings converges toward one? How long can spending continue if the flow that funds it stops for two quarters?
Each is measurable, and each maps to a disruption that has occurred somewhere in the last three years. Maximum drawdown, the crudest of them, already separated the Indian deciles by 35 percentage points.
Hamant proposes the stress test as the antidote to the performance indicator. The method is to apply a large fluctuation to a plan and watch what cracks: oil at ten times its current price, or no internet anywhere for six months. Two questions follow. Is this project robust, and does it serve the robustness of the territory it sits in? He lists four determinants that decide the answer.
Determinant | What it means | Financial equivalent |
|---|---|---|
Redundancy | A plan B, C and D exist | Cash, credit lines, import cover, a second supplier of capital |
Heterogeneity | Those plans differ from one another | Uncorrelated holders and varied funding sources |
Link to the living | Solutions draw on what is present on site | Domestic savings and local demand rather than borrowed flows |
Link to the territory | Deep social and economic ties to a place | Trade agreements, domestic supply, production inside the jurisdiction |
See what markets are pricing in
Live indices, sector moves and market breadth — the backdrop to every story we publish.
What happens when the calm breaks?
Realised volatility is low and the indices are reporting it accurately. The question is what the calm is built on. It sits inside a war-affected energy market, a geopolitical risk reading at a 25-year high, an inflation path revised upward, and an equity index whose earnings growth depends on a handful of companies executing an expensive bet.
Robustness costs money in every year when nothing happens. India held 11 months of import cover through a period when those dollars could have earned more elsewhere, and spent part of the buffer in March. Domestic funds bought through a quarter when foreign investors were leaving. Neither choice improved a performance metric. Both widened the range of conditions the system could pass through.
In a world increasingly described by its standard deviation, the useful question moves away from how fast a system runs on an ordinary day. It becomes how wide a distribution the system can pass through intact, and how quickly it finds out. Hamant's own answer to the anxiety that follows is that a system built around fluctuation stops treating fluctuation as a threat. A musician reading from a score is finished when the wind takes the page. A musician improvising uses whatever the room produces.


