

India's southwest monsoon began the 2026 season nearly 40% below normal. The India Meteorological Department recorded the shortfall in mid-June, and forecasters trace it to El Niño, a warming of the Pacific Ocean that is taking hold as one of the strongest on record. The monsoon delivers about 70% of India's annual rainfall and waters most of its farmland, so a weak season carries direct consequences for crops, food prices, water supply and economic growth. This article explains the link between El Niño and the monsoon, the state of the 2026 season, and what the deficit means for the agricultural economy.
What is El Niño, and why does it weaken the Indian monsoon?
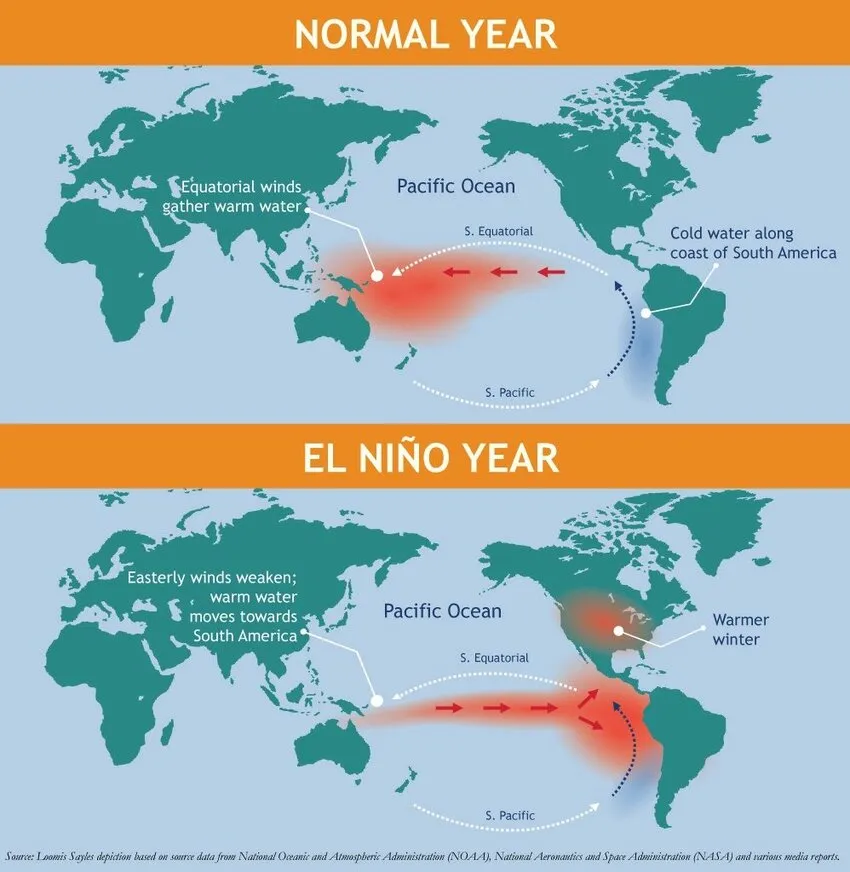
El Niño is a phase of the El Niño-Southern Oscillation (ENSO), a recurring climate cycle in the Pacific Ocean. In a normal year, strong trade winds push warm surface water westward toward Asia, where it evaporates and feeds the rains that reach India and its neighbours. During El Niño, those winds weaken and the warm water shifts back toward the central and eastern Pacific. Sea surface temperatures there rise by 0.5°C or more, and by 2°C to 3°C in a strong event, so the main rain-producing zone moves away from South Asia. The result for India is weaker monsoon winds and drier conditions.
The historical record is consistent. The IMD counted 15 El Niño years between 1951 and 2022, and every drought year in that period was an El Niño year. The reverse does not hold. El Niño raises the odds of a poor monsoon without guaranteeing one, and six of those 15 years still produced normal to above-normal rainfall.
El Niño is one factor among several
El Niño sets the broad odds, and other systems decide the final outcome. The Indian Ocean Dipole (IOD), a temperature contrast across the Indian Ocean, can pull in the opposite direction. A positive IOD supports the monsoon and can blunt El Niño's effect, while a negative IOD deepens the drying. Snow cover across Eurasia also influences how strongly the monsoon sets up. In 2023, a positive IOD and other favourable conditions lifted the season to 94% of the long-period average even with El Niño active. For 2026, the IMD has flagged the IOD and northern hemisphere snow cover as the factors that could soften the El Niño signal.
Check the macro backdrop
GDP, inflation, rates and more — India’s key economic indicators in one dashboard.
How weak is the 2026 monsoon so far?
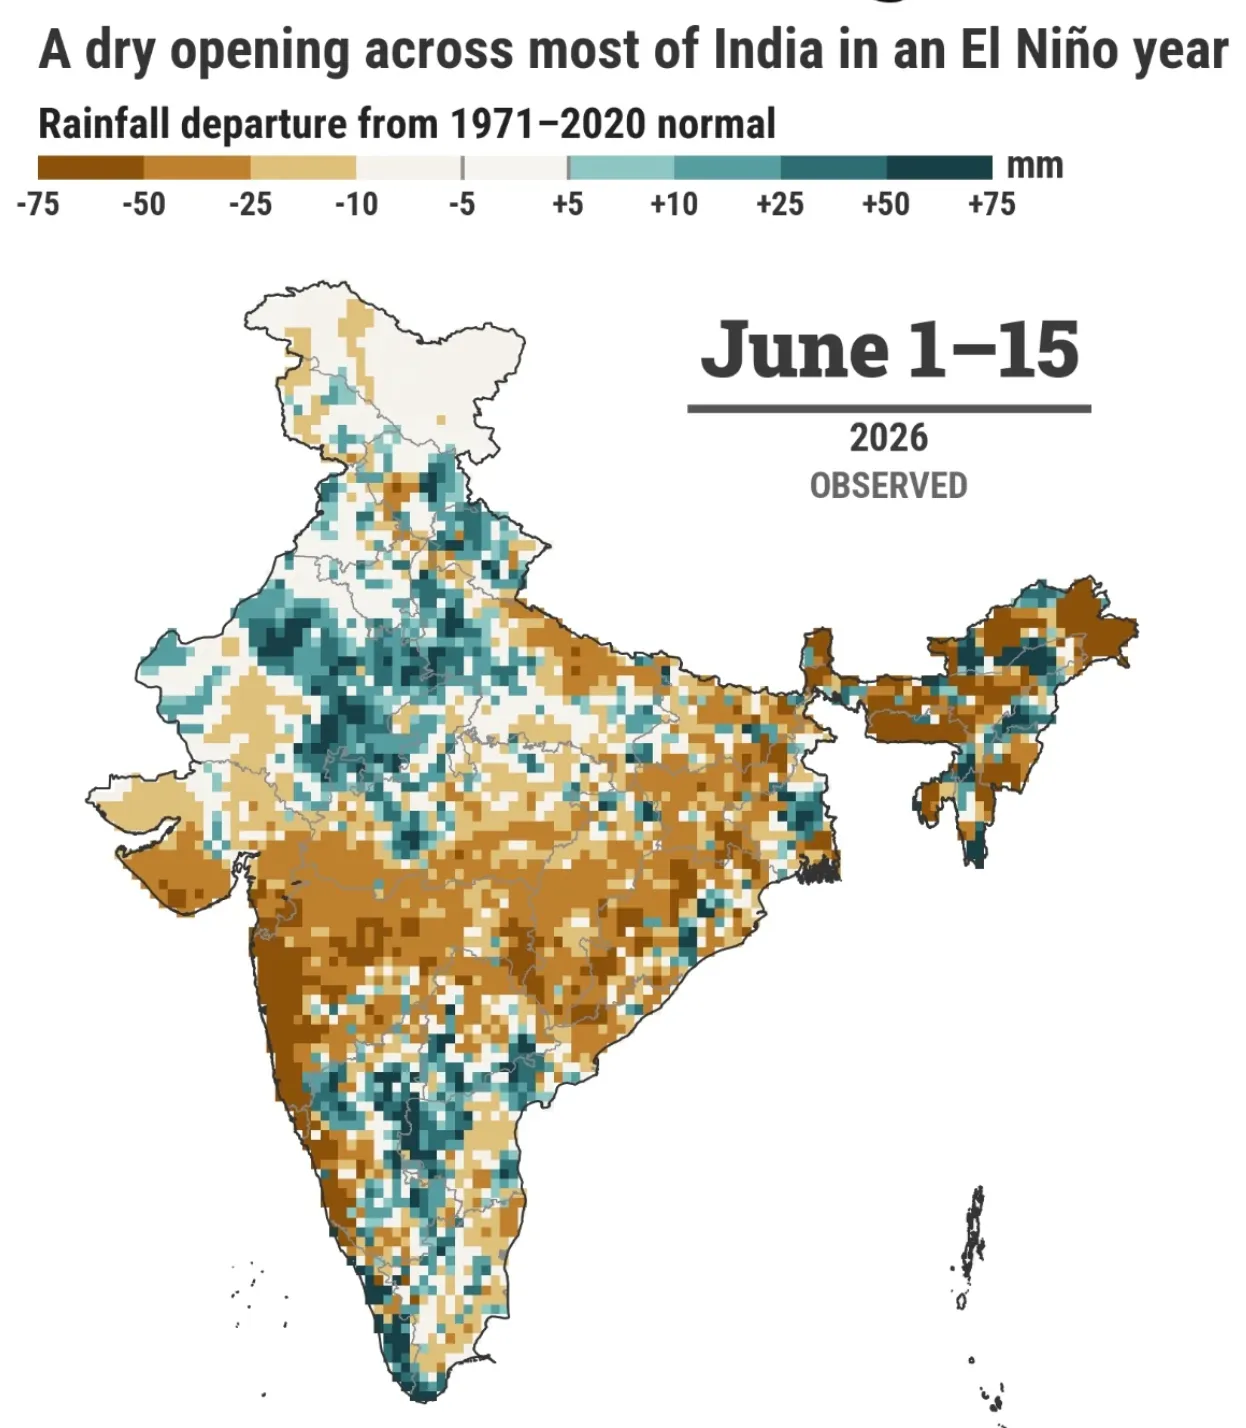
The season opened poorly. Nationwide rainfall stood at nearly 40% below normal in mid-June 2026, according to IMD data, with the largest shortfalls over the northwest and central regions. The monsoon arrived late, and weather models point to dry conditions persisting through July and August. Meteorologists tracking the season see no signal strong enough to pull the existing deficit back to normal, and expect any improvement to be regional and short-lived.
The full-season forecast is below normal. The IMD has placed 2026 rainfall at around 90% of the long-period average, which sits in its below-normal band, with anything under 90% classed as deficient. The APEC Climate Centre puts the probability of strong El Niño conditions from July to December at 99.4%, and US scientists expect the event to rank among the strongest measured. Official forecasts describe 2026 as the weakest monsoon in more than a decade.
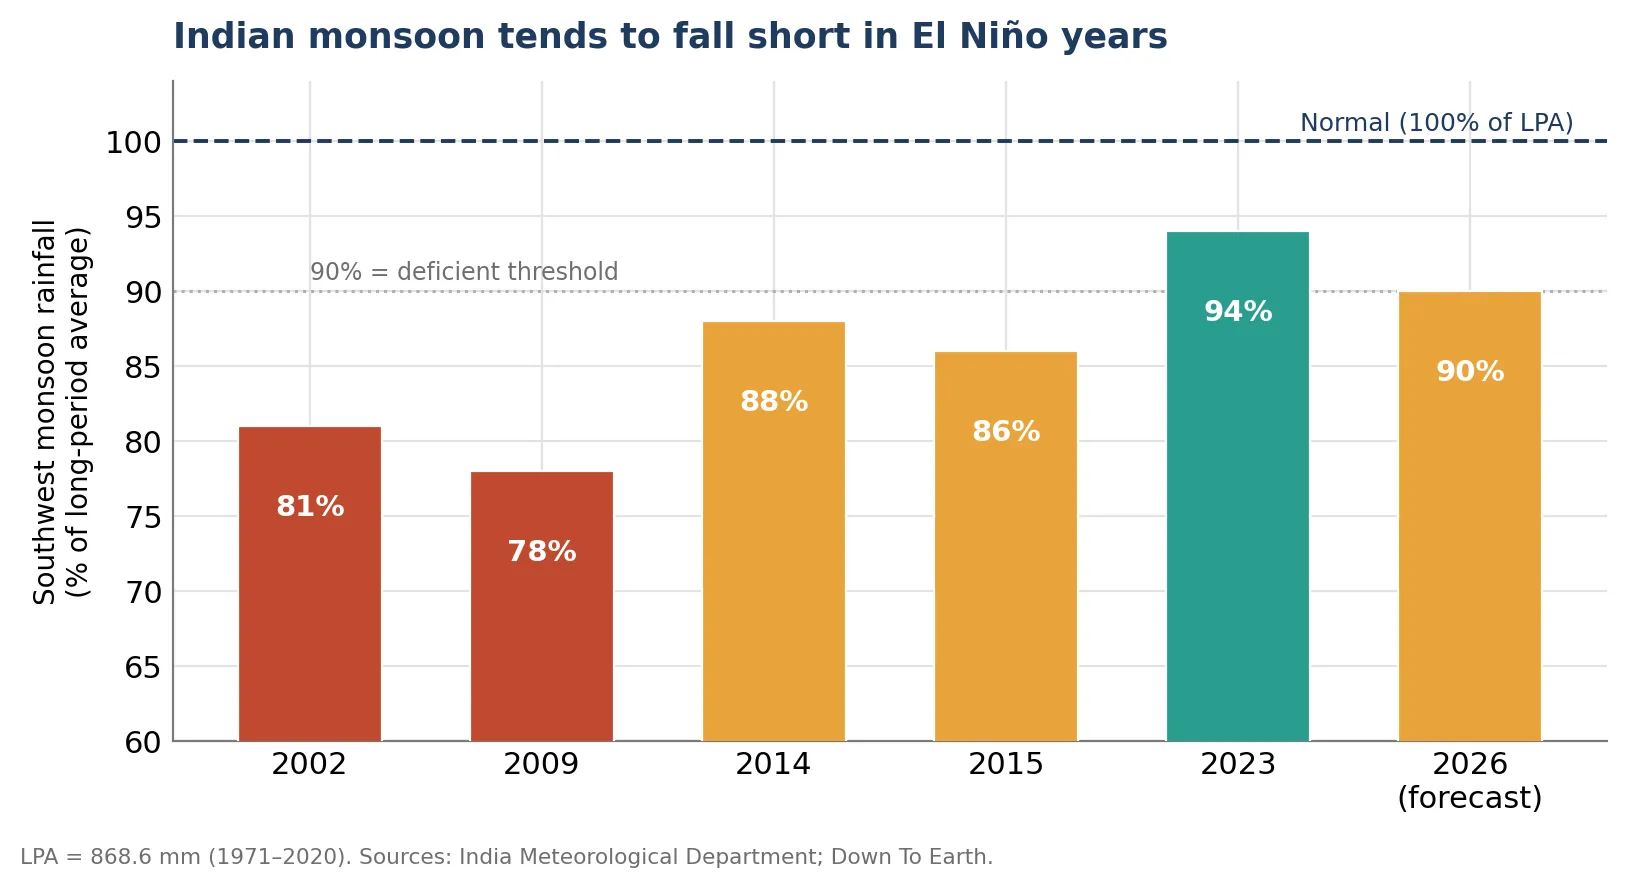
Figure 1. Southwest monsoon rainfall as a share of the long-period average in recent El Niño years, with the 2026 forecast.
The pattern matches the science. Deep El Niño years such as 2002 and 2009 brought rainfall well under 80% of the average. The 2015 super El Niño delivered 86%. The 2026 forecast of around 90% sits in the same below-normal territory, above the worst droughts but clearly short of a healthy season.
Why does a weak monsoon hit agriculture so hard?
Agriculture remains tied to the monsoon. About 60% of India's farmers depend on monsoon rainfall, and close to half of the country's farmland lacks assured irrigation. The kharif crops sown between June and October, including rice, soybeans, cotton, pulses and groundnut, rely almost entirely on these rains. A late or deficient monsoon shortens the sowing window, lowers soil moisture at key growth stages and reduces yields. When farmers pump groundwater to compensate, diesel and electricity costs climb, so output falls while input costs rise. Small and marginal farmers, who make up most agricultural households, carry that squeeze with the least cushion.
The 2026 season is already showing strain. Crop-weather monitors have issued severe dry alerts for India's soybean and groundnut belts, and the dryness threatens to delay soybean seeding and shorten the growing window. The agriculture ministry has flagged El Niño risk across 12 states and asked for district-level plans.
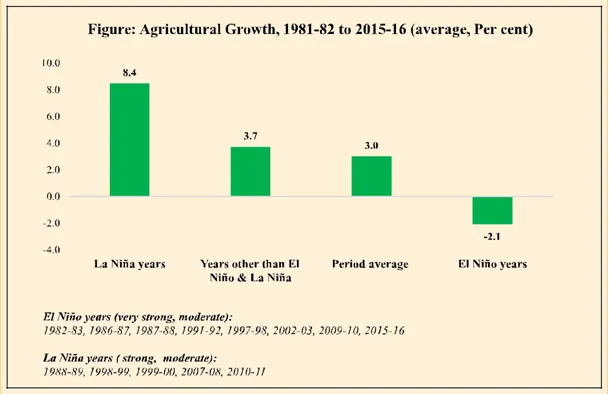
History shows how the damage scales. Data compiled by ICRIER from 1951 onward finds that 11 of 15 moderate-to-severe El Niño years brought a contraction in agricultural output, with an average 9.7% drop in monsoon rainfall and a 5.7% fall in kharif foodgrain production. The 2015-16 super El Niño is a recent benchmark: agricultural growth slowed to 0.5% that year as rainfall came in at 86% of the average.
Irrigation has softened the blow
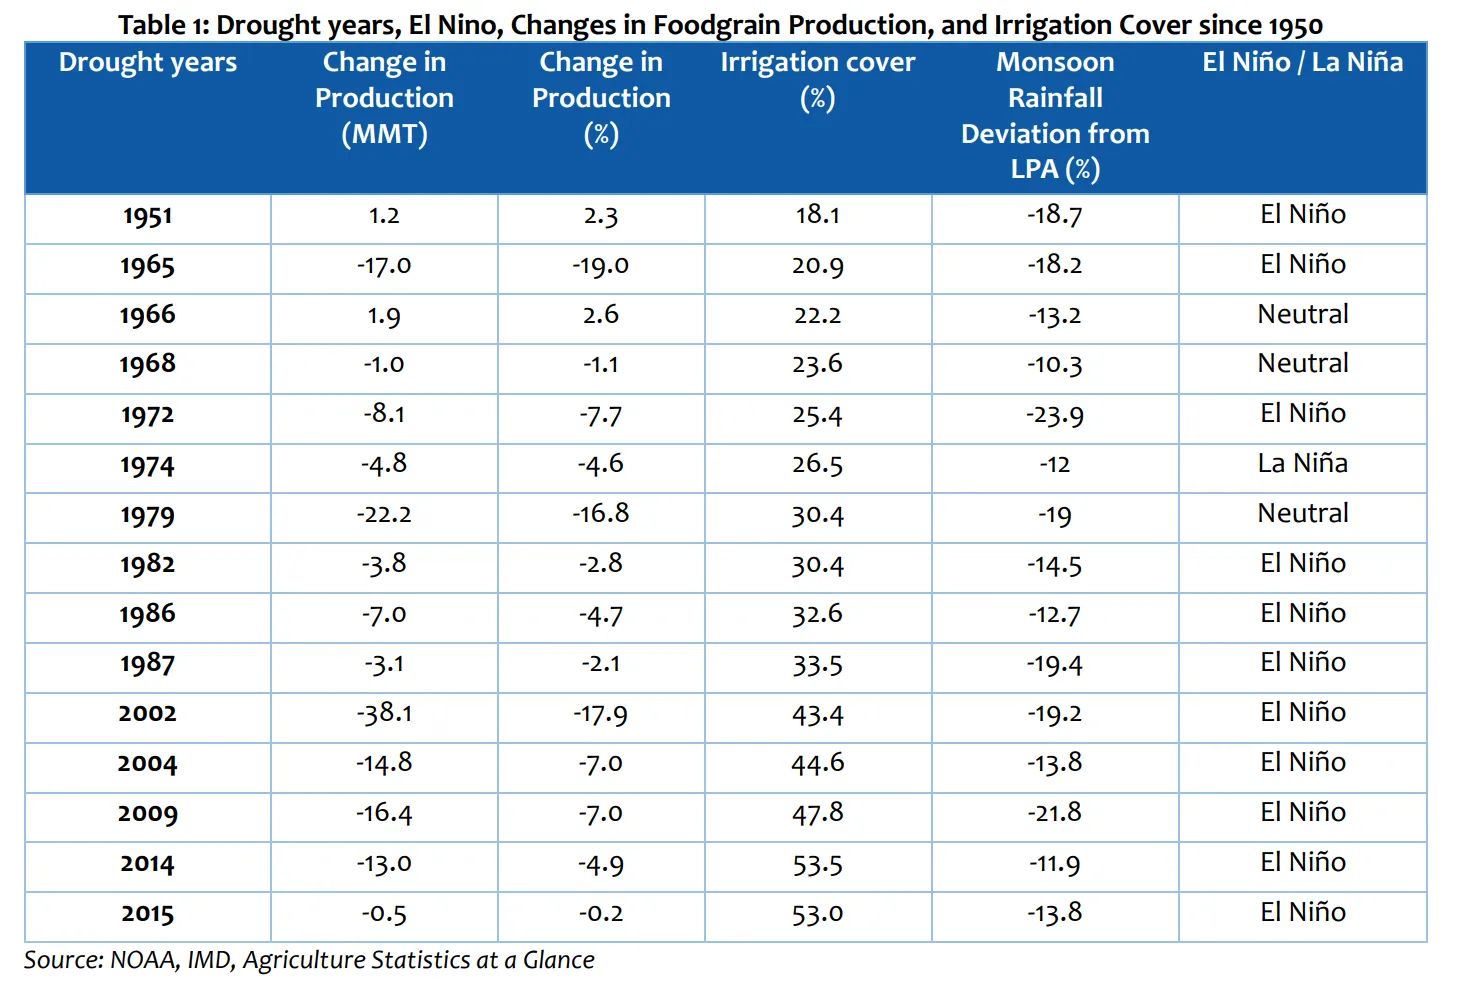
The link between rain deficit and lost output has weakened over time. Irrigation cover expanded from about 21% of cropped area in 1965 to about 53% in 2015. The effect is clear when two similar deficits are compared.
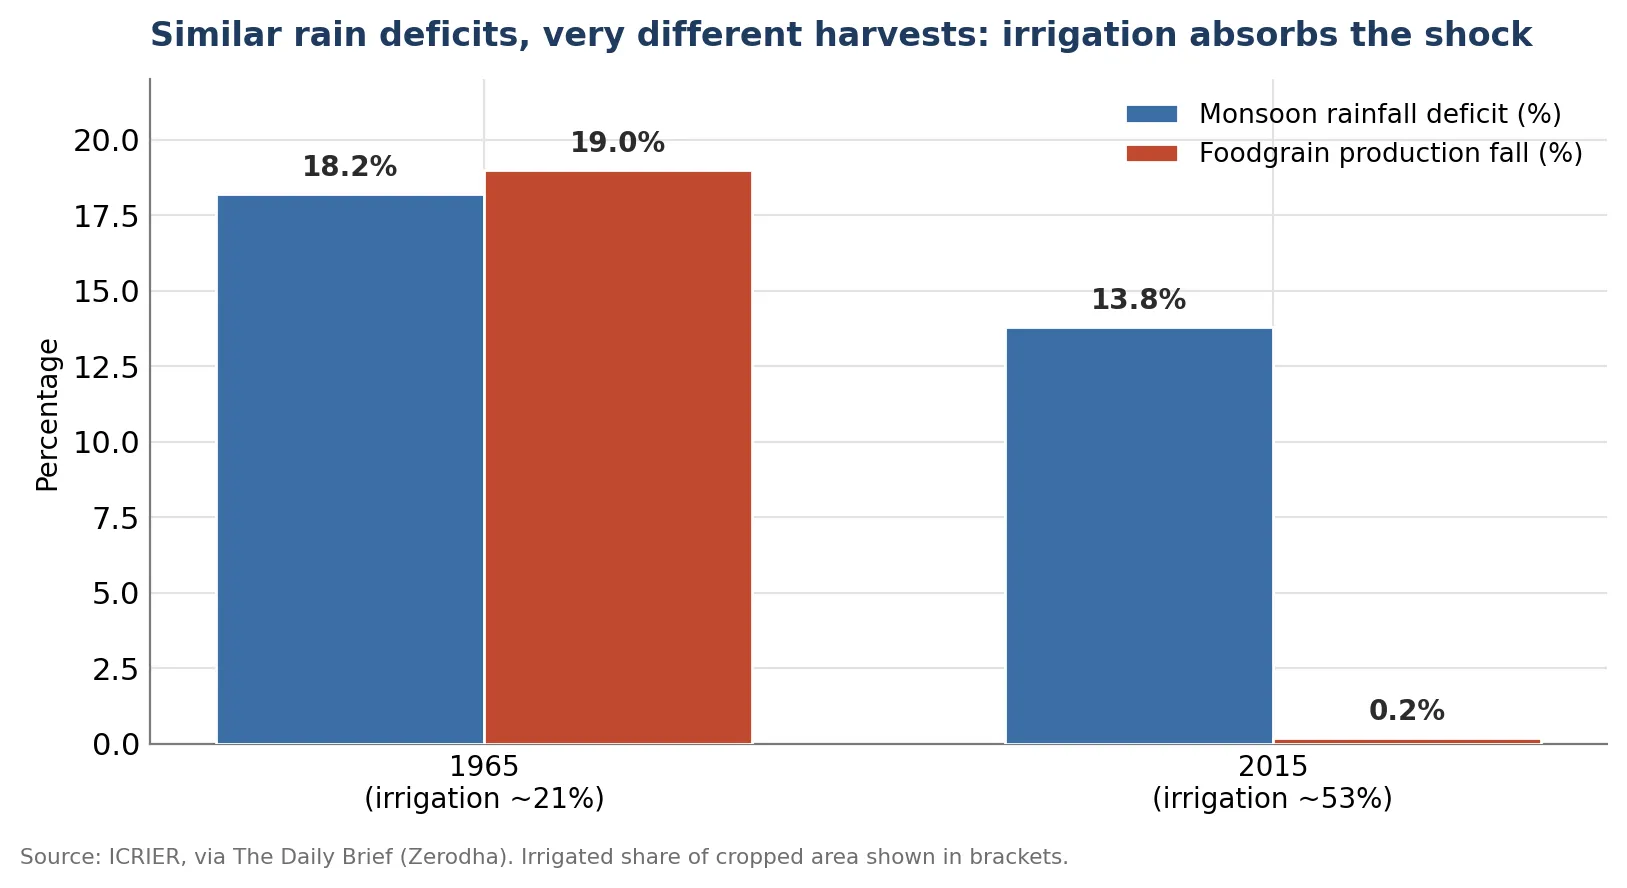
Figure 2. A comparable rainfall deficit produced a far smaller production fall in 2015 than in 1965, reflecting wider irrigation.
In 1965, an 18.2% rainfall deficit cut foodgrain production by 19%. In 2015, a comparable 13.8% deficit reduced production by only 0.2%. Irrigation, buffer stocks and improved seeds now absorb much of the shock that once translated straight into lost harvests. This resilience has limits, and a prolonged deficit across rainfed districts still bites.
Get research like this in your inbox
The week’s research that mattered, in five minutes. Joined by 2L+ investors.
What does the deficit mean for food prices and the wider economy?
The agricultural hit travels quickly into prices because food makes up close to half of India's consumer price index, a far larger share than the level seen in advanced economies. When harvests of rice, pulses, vegetables and sugar come in light, retail food inflation tends to follow. Lower domestic output also raises the chance that the government restricts exports of staples such as rice and sugar to protect local supply, which ripples into global markets given India's position as a leading producer.
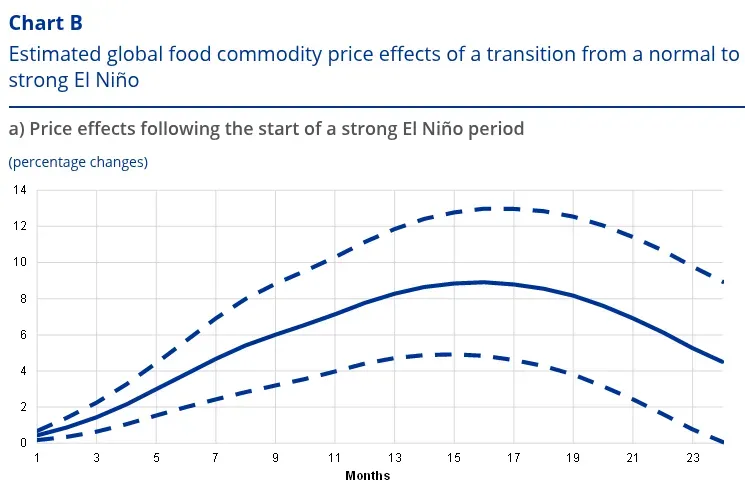
The pressure reaches beyond domestic crops. El Niño reshapes harvests worldwide, and one analysis of past events found that global food commodity prices rise by around 5% in an average El Niño year, with the effect lasting several months. India imports a large share of its edible oil, so higher world prices for palm oil and similar goods feed into domestic costs. The table below sets out the main channels through which a monsoon deficit reaches the economy.
Channel | What happens in a weak monsoon year |
Crop output | Kharif yields fall as sowing is delayed and soil moisture drops. Rice, pulses, soybean and cotton are the most exposed crops. |
Food inflation | Lower supply lifts retail prices. Food is close to half the consumer price index, so the effect on headline inflation is large. |
Rural incomes | Weaker harvests cut farm earnings and rural spending, which slows demand across the wider economy. |
Trade | The government may curb staple exports to protect domestic supply, affecting global rice and sugar markets. |
Imports | Higher world food and commodity prices raise the cost of edible oil and other imported goods. |
Power and water | Lower reservoir levels cut hydro output and drinking-water supply, raising costs for cities and industry. |
These channels explain why El Niño years tend to weigh on growth. Agriculture accounts for roughly 14% of GDP and employs more than half of India's workforce, so a poor farm season slows rural consumption and pulls on the wider economy.
How does a dry monsoon strain water and power?
The 2026 deficit is visible in the cities as much as in the fields. Mumbai's seven supplying reservoirs held just 10.35% of capacity by mid-June, leaving the financial capital with about 40 days of drinking water for roughly 13 million residents. The municipal corporation imposed a 10% cut on residential supply and 20% curbs on commercial users, and suspended water to construction sites for the first time in 12 years. Maharashtra recorded around 75% below-normal rainfall in the first half of June, the driest such stretch in over a decade, and households across Mumbai and Thane turned to private tankers as supply tightened.
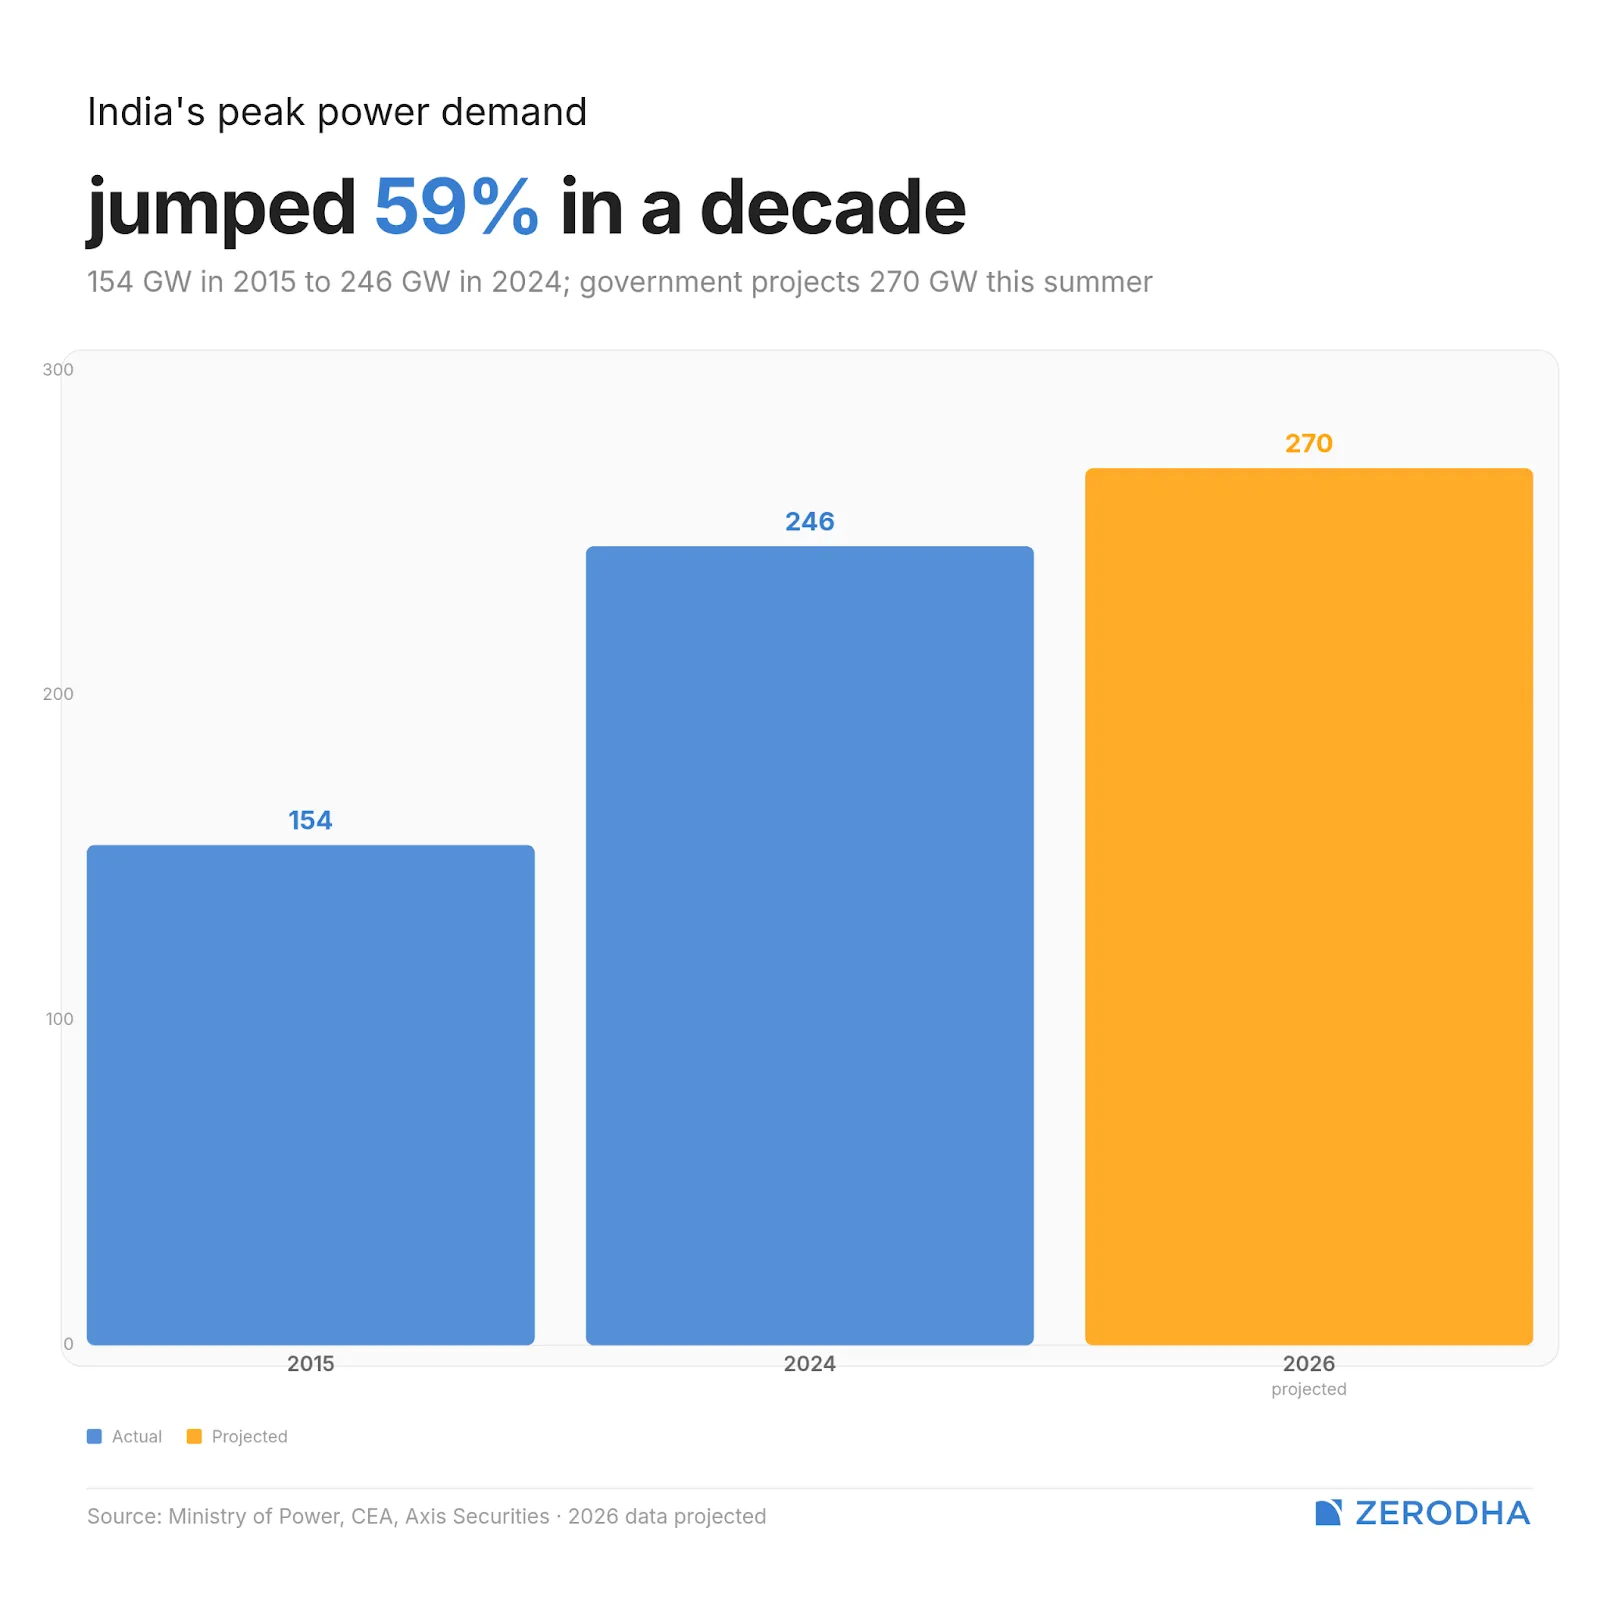
Power systems feel the strain through two routes. Hotter, drier El Niño summers raise cooling demand, while weaker rainfall drains the reservoirs that hydroelectric plants depend on. During the 2023-24 El Niño, hydro generation fell about 8% year-on-year in the first half of 2024 and coal-fired output rose to fill the gap. India's peak power demand reached 246 GW in 2024, up from 154 GW in 2015, and a weak monsoon pushes the grid further toward coal and gas to meet it. A drier sky does lift solar output in some states, which offsets part of the loss, though the net effect on the energy mix leans toward higher fossil-fuel use.
See what markets are pricing in
Live indices, sector moves and market breadth — the backdrop to every story we publish.
What should be watched through the rest of 2026?
July and August decide the season. These months bring the bulk of monsoon rainfall and cover the critical growth stages for kharif crops. Crop conditions can still recover if rains pick up soon, and forecasters expect brief regional improvements as the monsoon advances north into early July. The broader outlook past that window stays unfavourable while strong El Niño conditions hold.
Three things will shape the result. The first is whether a positive IOD develops and offsets part of the El Niño signal, as it did in 2023. The second is the spatial spread of the rain, since a national average can hide deep deficits in individual rainfed districts. The third is policy, where the government's kharif strategy, buffer-stock releases and any export controls will determine how far the farm shortfall reaches consumers. India's irrigation buffer now absorbs much of a below-normal monsoon's effect on food supply. A strong El Niño still raises real risks for farm incomes, food prices and water security through the rest of the year.


