


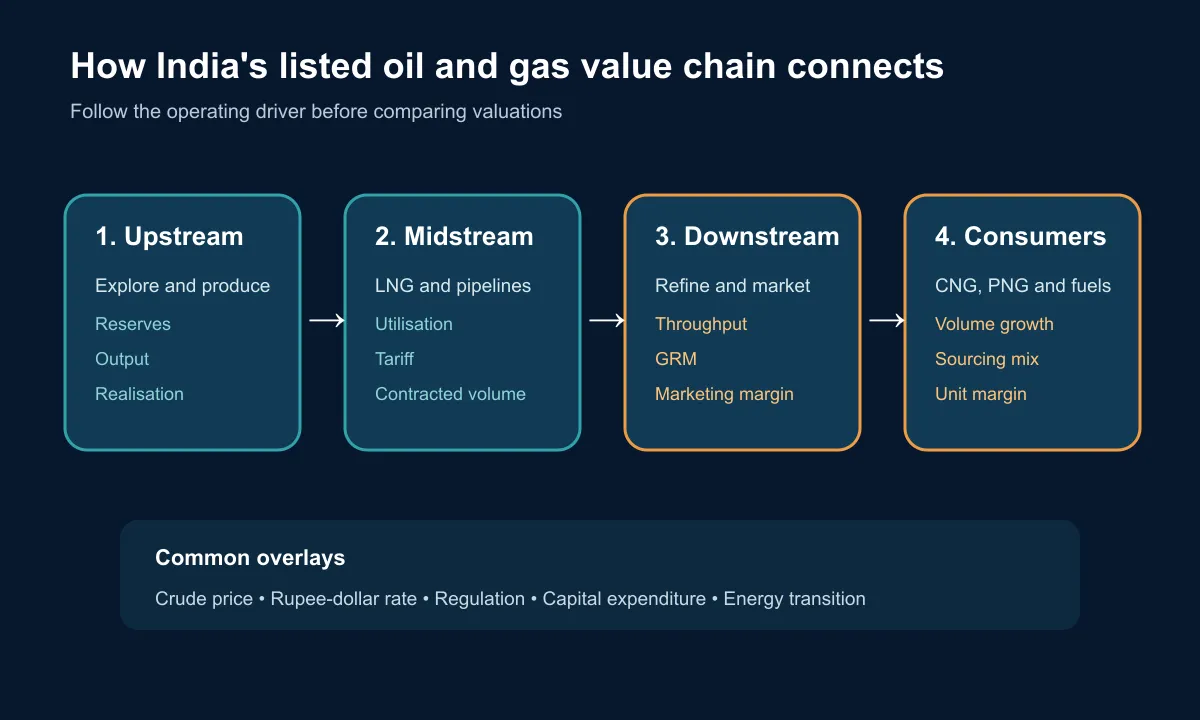
India's energy market contains very different businesses under one sector label. An upstream producer earns from discoveries and output, a refiner earns from converting crude into fuels, a pipeline operator transports molecules for a tariff, and a city-gas distributor sells CNG and piped gas. Consequently, a useful review of oil and gas stocks in India must begin with the value chain rather than a single valuation multiple.
India had 267.116 million tonnes per annum (MMTPA) of installed refining capacity on 1 April 2026, according to the Petroleum Planning and Analysis Cell (PPAC). That scale supports domestic fuel supply and petroleum-product exports, but it does not remove exposure to crude prices, the rupee, government pricing decisions or the energy transition. This guide maps the listed universe and explains what to verify before researching it.
Oil and Gas Stocks in India 2026: Company List by Segment
The following map covers prominent listed companies, not a buy list. Some operators span several segments, while subsidiaries may also be separately listed. Nayara Energy, HMEL and Numaligarh Refinery are important operating companies but are not independently listed equities. Investors should avoid double counting a subsidiary's capacity when analysing its listed parent on a consolidated basis.
| Segment | Listed companies commonly researched | Principal earnings driver | Main sensitivity |
|---|---|---|---|
| Upstream production | ONGC, Oil India, Hindustan Oil Exploration, Selan Exploration | Oil and gas output multiplied by realised price | Reserves, production decline, crude and gas prices |
| Integrated energy | Reliance Industries, ONGC, Oil India | Combination of production, refining, petrochemicals or downstream subsidiaries | Segment mix and capital allocation |
| Refining and marketing | Indian Oil, BPCL, HPCL, Chennai Petroleum, MRPL | Refining margin, throughput and fuel-marketing margin | Crude slate, product cracks and pricing controls |
| Gas transmission and trading | GAIL (India) | Pipeline tariffs, gas marketing and petrochemicals | Volumes, tariffs and gas availability |
| LNG infrastructure | Petronet LNG | Regasification volumes and terminal utilisation | Contract utilisation and competing capacity |
| City-gas distribution | Indraprastha Gas, Mahanagar Gas, Gujarat Gas, Adani Total Gas | CNG and piped-gas volumes and unit margin | Gas allocation, competition and regulation |
| Oilfield services | Jindal Drilling, Deep Industries, Asian Energy Services | Rig, drilling and field-service utilisation | Producer capital expenditure and contract execution |
This segmentation is the cleanest starting point for comparing oil and gas stocks in India. The list of oil and gas companies in India includes state-controlled enterprises, private integrated groups and smaller specialists, so governance, dividend policy and capital intensity vary widely.
See what markets are pricing in
Live indices, sector moves and market breadth — the backdrop to every story we publish.
Upstream Producers: Exploration and Production
ONGC and Oil India are the principal listed upstream producers. ONGC reported FY2025-26 standalone crude production of 18.355 million tonnes, plus 1.170 million tonnes from joint ventures and 0.977 million tonnes of condensate. Standalone natural-gas production was 19.533 billion cubic metres. Its overseas arm, ONGC Videsh, produced 9.671 million tonnes of oil equivalent. These figures illustrate why ONGC's valuation depends on production replacement, realised prices and government levies, not only the daily Brent quote.
Oil India has a smaller production base and strategic exposure to the North-East. It also participates downstream through Numaligarh Refinery. Hindustan Oil Exploration and Selan Exploration are smaller pure-play names whose individual fields, drilling programmes and reserve revisions can have a proportionately larger effect on value.
For upstream oil stocks in India, examine proved and probable, or 2P, reserves; reserve-replacement ratio; production growth; finding and development cost; and lifting cost per barrel of oil equivalent. The Directorate General of Hydrocarbons reported 434 million tonnes of 2P oil reserves and 643 BCM of 2P natural-gas reserves in India as of 1 April 2024. Those national figures are context, not reserves attributable to any one company.
Production-sharing terms, administered gas prices and windfall-type levies can weaken the link between international prices and shareholder earnings. Smaller oil company stocks may appear more responsive to a discovery, but they also carry greater field concentration and financing risk.
Refining and Oil Marketing Companies
Indian Oil, BPCL and HPCL combine refining with nationwide fuel marketing. Chennai Petroleum is an Indian Oil subsidiary, while MRPL is controlled by ONGC. Reliance Industries operates two large Jamnagar refineries and integrates refining with petrochemicals and other businesses.
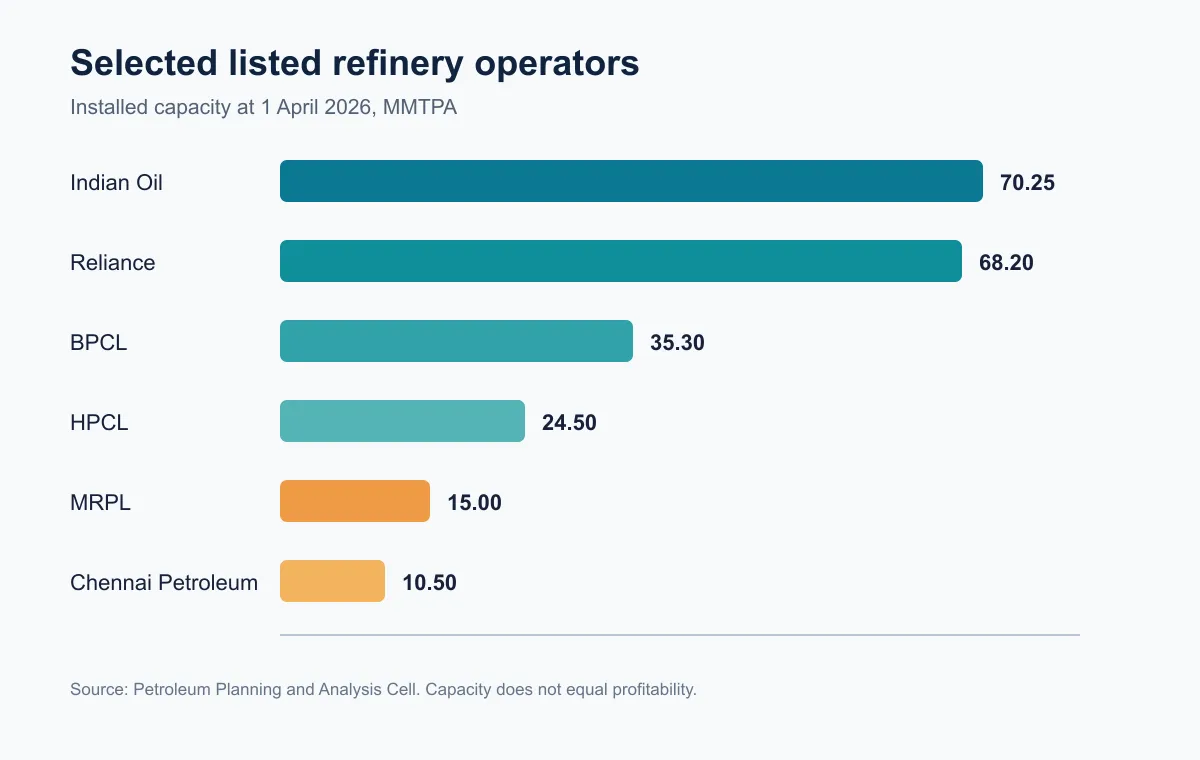
PPAC's capacity data as of 1 April 2026 shows why scale matters. Indian Oil's nine refineries totalled 70.25 MMTPA; Reliance's two Jamnagar units totalled 68.2 MMTPA; BPCL operated 35.3 MMTPA; HPCL operated 24.5 MMTPA; MRPL had 15 MMTPA; and Chennai Petroleum had 10.5 MMTPA. Capacity is not profitability. Complexity, crude flexibility, energy efficiency, maintenance shutdowns and product yield determine how much margin each barrel produces.
Gross refining margin, or GRM, measures the difference between the value of petroleum products and crude plus processing costs. Marketing margin measures profit or loss on retail fuel sales. A refiner can benefit when diesel and petrol cracks widen even if crude falls; a marketer can be hurt if pump prices do not adjust while input costs rise. This is why petroleum stocks in India should not be ranked using crude direction alone.
When comparing oil stocks in India , separate refinery throughput, utilisation and GRM from marketing volumes and per-litre margin. Also identify whether a company reports standalone or consolidated numbers, especially where a listed parent owns a separately listed refiner.
Natural Gas Producers, Pipelines and City-Gas Networks
The gas universe includes producers, import infrastructure, transmission networks and distributors. ONGC and Oil India produce domestic gas. Petronet LNG receives and regasifies imported LNG. GAIL owns major pipelines and also markets gas and operates petrochemical assets. Indraprastha Gas, Mahanagar Gas, Gujarat Gas and Adani Total Gas distribute CNG and piped natural gas in authorised geographical areas.
These gas stocks in India react differently to the same event. Lower LNG prices may support industrial demand and city-gas margins, but reduce realisations for a producer. Higher pipeline utilisation can benefit a transporter even when the commodity price falls. City-gas distributors depend on volume growth, sourcing mix, allocation of lower-cost domestic gas and the ability to pass costs to customers.
For natural gas stocks in India, track transmission volume, tariff orders, terminal utilisation, contracted capacity, CNG station expansion and industrial demand. A regulatory authorisation is valuable only if the distributor can build the network, acquire customers and earn an adequate return on capital.
Integrated Energy Companies vs Pure-Play Operators
Integration can smooth earnings because weakness in one segment may be offset elsewhere. A decline in crude may hurt an upstream operation but improve feedstock economics for refining or petrochemicals. Reliance combines refining, petrochemicals and newer consumer businesses. ONGC combines domestic and overseas production with stakes in HPCL and MRPL. Oil India combines production with a downstream interest in Numaligarh Refinery.
The trade-off is complexity. Investors must value each segment separately and account for holding-company structure, minority shareholders, inter-company transactions and capital allocation. A sum-of-the-parts approach can be more informative than applying one price-to-earnings ratio.
Pure-play oil company stocks offer clearer operating exposure but less diversification. A small explorer can be driven by one basin; a city-gas company by a few territories; and a drilling contractor by a limited order book. The right comparison group therefore depends on the economic engine, not the word “energy” in a company description.
Get research like this in your inbox
The week’s research that mattered, in five minutes. Joined by 2L+ investors.
Key Financial Metrics: Reserves, Production, Margins and Debt
Use a segment-specific dashboard rather than one generic checklist.
| Business model | Operating metrics | Financial metrics | Questions to ask |
|---|---|---|---|
| Upstream | 2P reserves, reserve replacement, output, lifting cost | Realisation, EBITDA per barrel, exploration spend | Is production growing without excessive development cost? |
| Refining | Throughput, utilisation, complexity, product yield | GRM, inventory gain or loss, return on capital | Is margin structural or the result of a temporary crack spread? |
| Marketing | Retail volume, outlet count, market share | Per-unit marketing margin, working capital | Can input-cost increases be passed through promptly? |
| Pipeline or LNG | Capacity, utilisation, contracted volume | Tariff, EBITDA per unit, cash conversion | Is expansion backed by demand or take-or-pay contracts? |
| City gas | CNG/PNG volume, stations, connections | Unit EBITDA, capex, return on capital | How exposed is margin to gas allocation and competition? |
Debt deserves special attention because projects take years and require large upfront capital. Compare net debt with EBITDA, interest coverage, free cash flow and committed capital expenditure. A low trailing multiple can be deceptive when profits include inventory gains, exceptional dividends or a favourable commodity peak.
Among oil and gas companies in India, also reconcile standalone and consolidated cash flows. Dividends from subsidiaries can make standalone earnings look strong without changing group cash generation. For petroleum stocks in India, compare cycle-adjusted returns on capital rather than one year's GRM.
How Crude Prices and Rupee Movements Affect Different Segments
India imports most of the crude it processes, so a stronger dollar raises the rupee cost of oil. Upstream producers may receive higher rupee realisations when dollar crude rises, subject to pricing rules and levies. Refiners face higher feedstock costs but can still earn more if product cracks widen. Marketers can suffer when retail prices lag costs. Gas importers and distributors also face dollar-linked LNG exposure.
The sequence matters: crude price, product price, exchange rate, inventory timing and retail-price revision do not move together. Inventory gains can temporarily lift a refiner's reported profit during a rising market, then reverse when prices fall. Dollar debt and hedging can further change the outcome.
Investors can use Wright Research's market dashboards alongside company disclosures to monitor the broad regime. For a recent example of how geopolitical supply expectations can affect oil stocks in India, see this analysis of crude-price shocks and oil industry stocks. Scenario analysis is more useful than assuming every company moves one-for-one with Brent.
Policy, Pricing Controls and the Energy Transition
Government policy affects fuel prices, domestic gas allocation, pipeline tariffs, exploration terms and dividends from state-controlled companies. Public-sector marketers may sometimes balance commercial returns with supply and affordability objectives. Investors should read subsidy receivables, under-recovery disclosures and board-approved capital plans rather than infer policy from headlines.
The transition creates both risk and investment requirements. Electric vehicles can reduce long-run road-fuel demand growth, while natural gas may gain as a transition fuel in industry and transport. Refiners are investing in petrochemicals, biofuels, green hydrogen, renewable power and charging networks. These projects can extend relevance, but they also introduce execution risk and may initially earn lower returns than mature assets.
For natural gas stocks in India, monitor whether demand growth offsets new infrastructure and competition. For oil and gas stocks in India, test capital expenditure against realistic utilisation, carbon intensity and cost of capital. An “energy transition” label does not guarantee profitable diversification.
Risk Checklist for Researching Oil and Gas Stocks
Before investing, work through these risks:
- Commodity and crack-spread risk: model high, base and low realisations instead of extrapolating a peak.
- Reserve and geological risk: distinguish resources from commercially recoverable 2P reserves.
- Policy risk: review pricing controls, taxes, royalties, tariffs and subsidy receivables.
- Currency risk: identify dollar-linked inputs, exports, debt and hedges.
- Execution risk: examine cost overruns, commissioning delays and shutdown history.
- Balance-sheet risk: include leases, guarantees and committed expansion, not only reported borrowings.
- Environmental and safety risk: review spills, emissions, accidents, litigation and remediation obligations.
- Governance risk: assess related-party transactions, subsidiary structure and capital allocation.
This checklist is particularly important for smaller gas stocks in India and explorers where one project can dominate value. It also prevents investors from treating all petroleum stocks in India as equivalent high-dividend proxies.
How to Track Results and Sector Updates
Start with quarterly presentations, exchange filings and annual reports. For upstream companies, record production, sales volume, realisation, lifting cost and reserves. For refiners, record throughput, utilisation, GRM and marketing margin. For gas businesses, track volume, tariff, sourcing mix and unit EBITDA.
Then cross-check company claims against PPAC's ready reckoners and refinery data, DGH's production and reserve publications, Petroleum and Natural Gas Regulatory Board orders, and Ministry of Petroleum and Natural Gas releases. Refresh the company list after mergers, listings, delistings or major changes in ownership.
A practical watchlist for oil and gas stocks in India should show the segment, two operating metrics, net debt, planned capex and the next regulatory catalyst. That format makes oil and gas companies in India comparable without forcing them into one simplistic ranking. Revisit assumptions each quarter and rebuild the valuation when the commodity or policy regime changes materially.
Follow this sector’s live moves
Sector-level performance across Indian markets, updated through the day.
FAQ
Can retail investors get oil and gas exposure through ETFs or mutual funds in India?
Yes, but choices may be indirect. Broad index funds and diversified equity funds can own energy companies, while some sector or PSU-oriented schemes may hold larger weights. Check the latest portfolio, expense ratio and concentration rather than relying on the scheme name.
Where can investors verify official oil and gas production data for India?
Use PPAC, the Directorate General of Hydrocarbons, the Ministry of Petroleum and Natural Gas and company exchange filings. Match the period, unit and standalone or consolidated scope before comparing figures.
Do oil and gas companies generally follow the same dividend policy?
No. Dividends depend on ownership, cash flow, capital expenditure, debt and board policy. State-controlled companies may have different payout considerations from private groups, and a high historical yield is not guaranteed.
How often should an oil and gas stock list be refreshed?
Review operating data quarterly and rebuild the full list at least annually. Update it sooner after a listing, merger, ownership change, major discovery, capacity commissioning or regulatory change.
The essential lesson is that oil and gas stocks in India represent several business models, not one commodity bet. Segment the universe, use the correct operating metrics and test policy, currency and balance-sheet risks before reaching a valuation conclusion.
For education only, not investment advice. Company and sector data are dated and can change. Consult a SEBI-registered investment adviser where appropriate.


