


India's investment numbers improved sharply in 2026. Gross fixed capital formation (GFCF), the measure of spending on fixed assets, grew 11.9% in real terms in the April to June quarter, its fastest pace in more than three years, and investment rose to about 34% of GDP. Over the same period, foreign portfolio investors pulled more than ₹3 lakh crore out of Indian equities, and by early October the Nifty 50 was down nearly 14% for the year.
Both trends lead to the same question. Companies, domestic savers and global funds are looking past the amount of capital being spent and asking what that capital earns. On that test India has ground to make up. The value produced by each unit of capital remains below its 2019 level, and the private sector's share of total investment has slipped. This article looks at why private firms remain cautious, what kind of capital India is building, and how the answer shapes the Indian economy and its stock market in a year when global money is chasing returns elsewhere.
Is private investment in India actually recovering?
Investment intentions are rising faster than investment spending. The RBI's latest study of private corporate investment shows the cost of projects sanctioned by banks and financial institutions reached a record ₹4.4 lakh crore in 2025-26, up from ₹3.7 lakh crore a year earlier. Based on the pipeline of projects across bank loans, external borrowing and IPOs, the RBI expects private capex of about ₹3.2 lakh crore in 2026-27, against ₹2.6 lakh crore in 2025-26. Credit to industry grew close to 20% in mid-2026.
The national accounts show a slower shift. The private sector's share of GFCF fell from 35.3% in 2021-22 to 32.2% in 2024-25, and the government and public sector companies carried a larger part of the load. Union ministers have repeatedly urged companies to invest more. The Economic Survey 2025-26 identified a high cost of capital as one constraint, and Deloitte's October outlook said private investment has taken longer to recover than expected despite better connectivity and stronger corporate balance sheets.
Financing is available, expected returns are the hurdle
Indian companies entered 2025-26 with healthier balance sheets and larger cash buffers, according to the RBI, and banks are well capitalised. The money to invest exists. How much of it gets spent depends on the return companies expect from new capacity, and that is where the data is weakest.
Check the macro backdrop
GDP, inflation, rates and more — India’s key economic indicators in one dashboard.
Why does capital productivity decide how much companies invest?
Capital productivity measures the gross value added produced per unit of capital. It shows whether money put into plants, roads and machines is raising output. According to the RBI's data, India's capital productivity stood at 0.315 in 2019 and 2020, dropped to 0.289 in 2021 and was 0.291 in 2023. Construction and manufacturing saw the steepest declines between 2019 and 2023, extending a gradual fall that began around 1999.
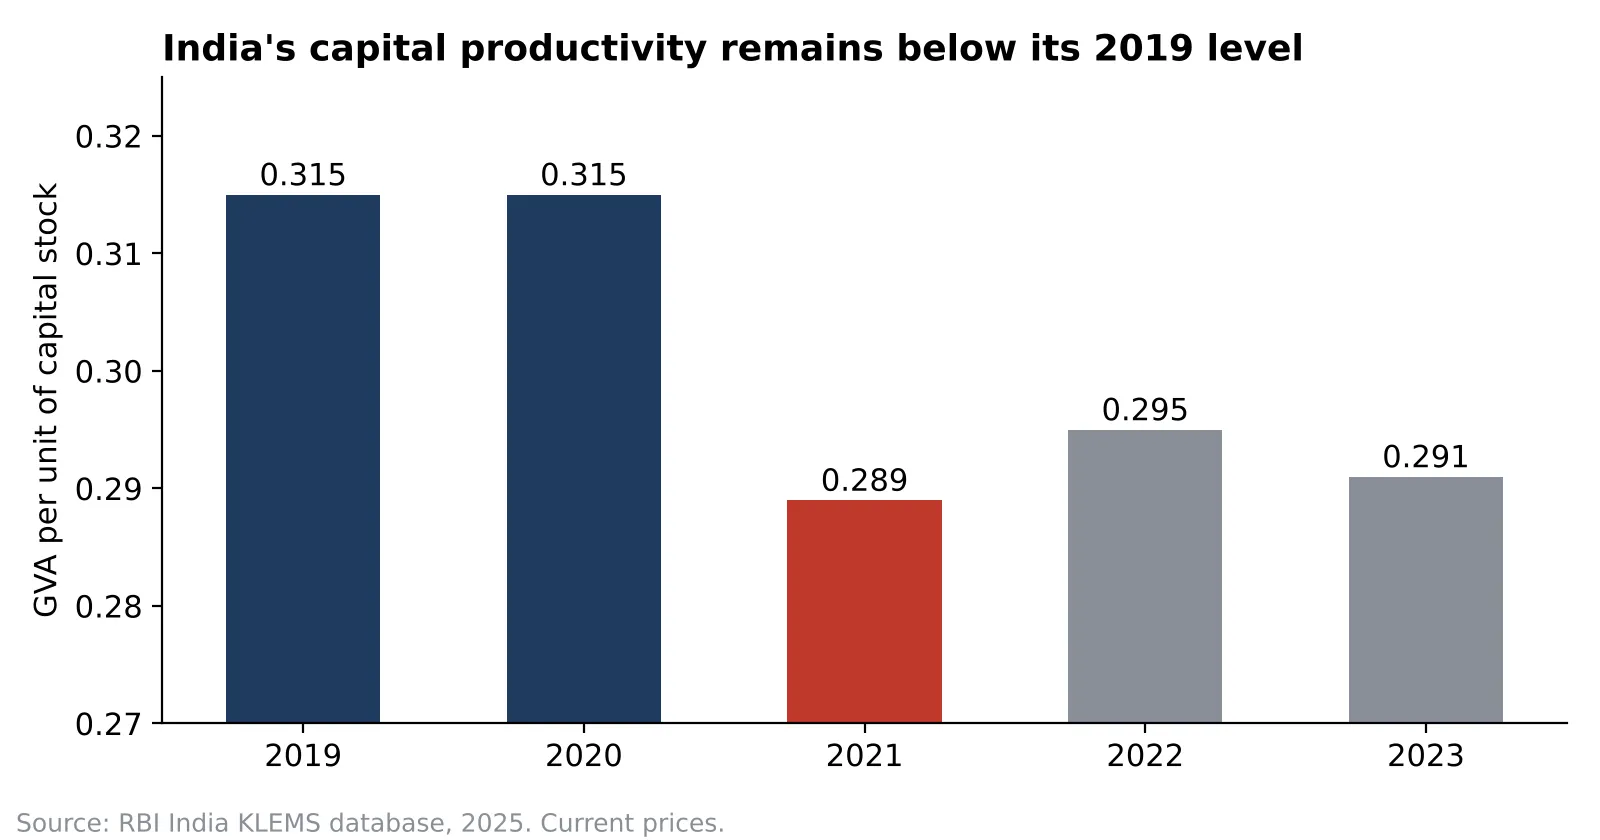
When each new rupee of capital produces less output, the return on that rupee falls. A company deciding whether to build a second plant first looks at how its existing plant is performing. If that plant is running below capacity and margins are under pressure, expansion waits.
Three forces are holding productivity down
Idle capacity. Manufacturing capacity utilisation averaged 74.8% after the pandemic, below the 76.2% average of 2009-14. It reached 75.6% in late 2025 and has stayed in a narrow band since. Firms generally wait until existing plants are close to full before committing to new ones.
Thinner operating surplus. Lower operating margins reduce both the internal funds and the confidence needed to commit to long projects.
Capital deepening without matching output. Capital per worker has risen across mining, manufacturing, construction and services. In most years since 2017-18, output per worker grew more slowly than the capital behind each worker.
Demand has set the ceiling
Over the three years to 2025-26, exports and government consumption grew more slowly than GDP. A growing share of household demand went to gold and precious metals, most of which India imports. Each of these limits the need for new domestic capacity. Companies are investing in line with the demand they can see.
What kind of capital is India building?
The composition of investment explains much of the delay in returns. Infrastructure accounted for 54.2% of the cost of private projects sanctioned by banks in 2025-26, and power alone for 39.6%. About 89% of sanctioned project cost went to new ventures, with roughly 10% for expanding or modernising existing plants.
Category | 2018-19 | 2022-23 | 2024-25 | 2025-26 |
|---|---|---|---|---|
Infrastructure | 60.3 | 58.6 | 50.5 | 54.2 |
of which power | 26.8 | 20.0 | 39.7 | 39.6 |
of which roads and bridges | 10.4 | 35.6 | 8.9 | 8.5 |
Construction | 2.3 | 4.0 | 5.6 | 11.2 |
Metals and metal products | 3.0 | 16.4 | 4.6 | 4.8 |
New projects (greenfield) share | 76.8 | 93.2 | 91.6 | 89.2 |
Greenfield infrastructure takes years to build and is exposed to time and cost overruns. Its output arrives long after the money is spent. Some completed renewable energy projects are waiting for grid connections, and developers have sought compensation to stay viable. Traffic on several national expressways remains below planned levels, which delays the lower transport costs they were built to deliver. Capital sitting in assets that are finished but under-used pulls down measured productivity until demand catches up.
Intellectual property is the encouraging shift
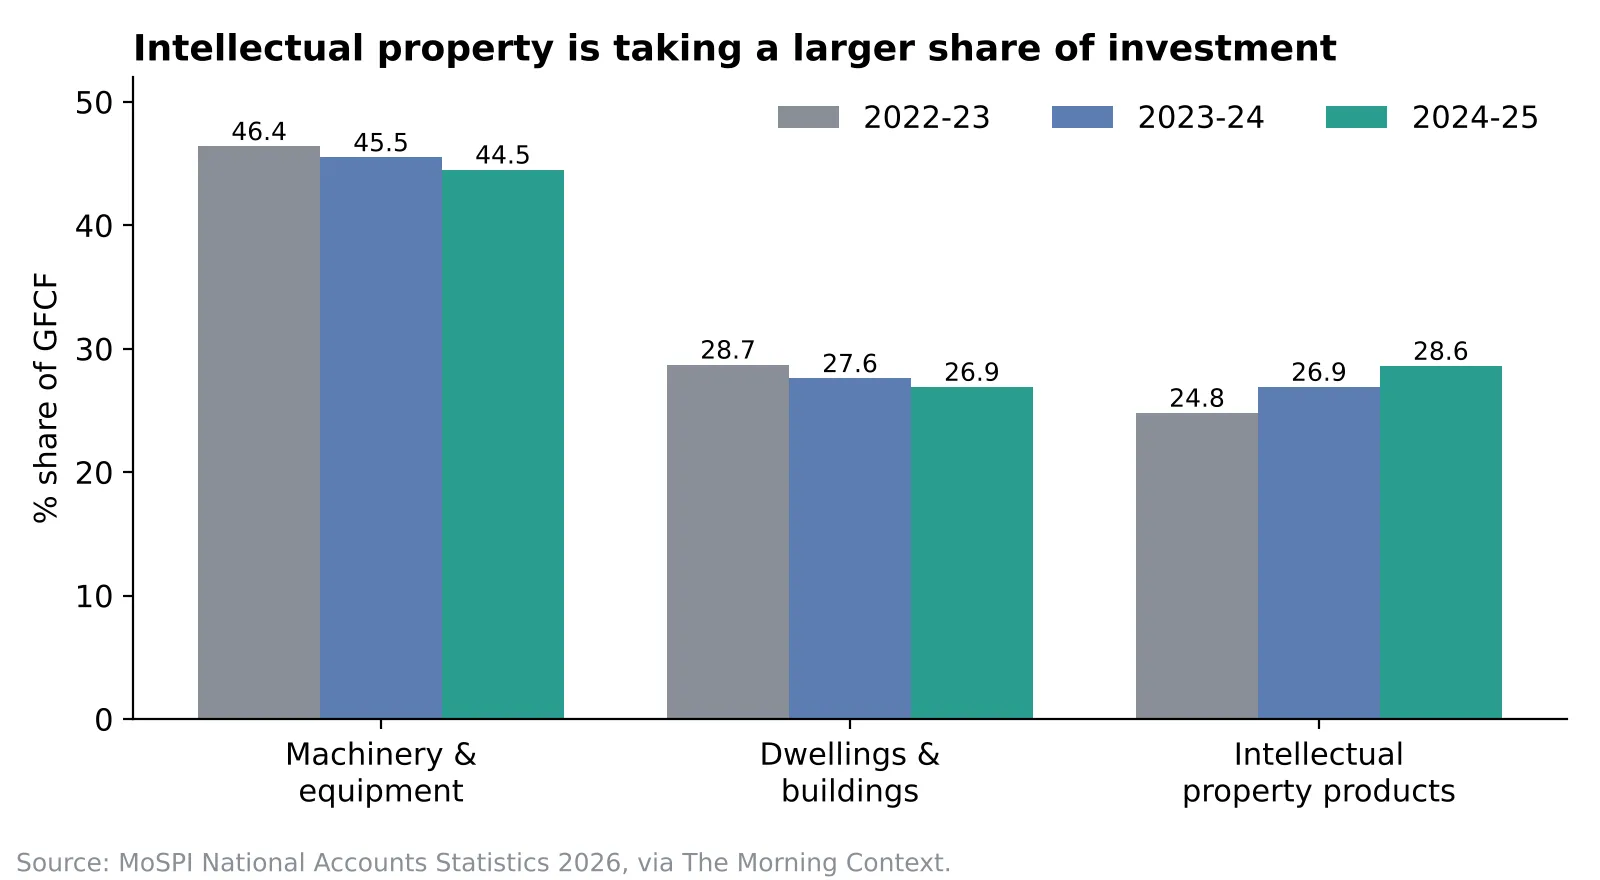
Intellectual property products, which cover software, research and databases, rose from 24.8% of GFCF in 2022-23 to 28.6% in 2024-25. Machinery and buildings both lost share. This type of investment aims to raise output from assets and workers already in place, and it usually shows results sooner than a new plant.
Get research like this in your inbox
The week’s research that mattered, in five minutes. Joined by 2L+ investors.
Where is global capital going in 2026, and why?
Global investors are paying for visible returns on capital, and in 2026 they have found them in the AI supply chain. The IMF's October World Economic Outlook credits AI investment with supporting world growth of 3.1% this year. The four largest US cloud and platform companies plan about US$730 billion of capital spending in 2026, and global chip sales are forecast to reach roughly US$1.5 trillion. Taiwan and South Korea supply most of the world's AI computing hardware, and their stock markets have pulled ahead of India's.
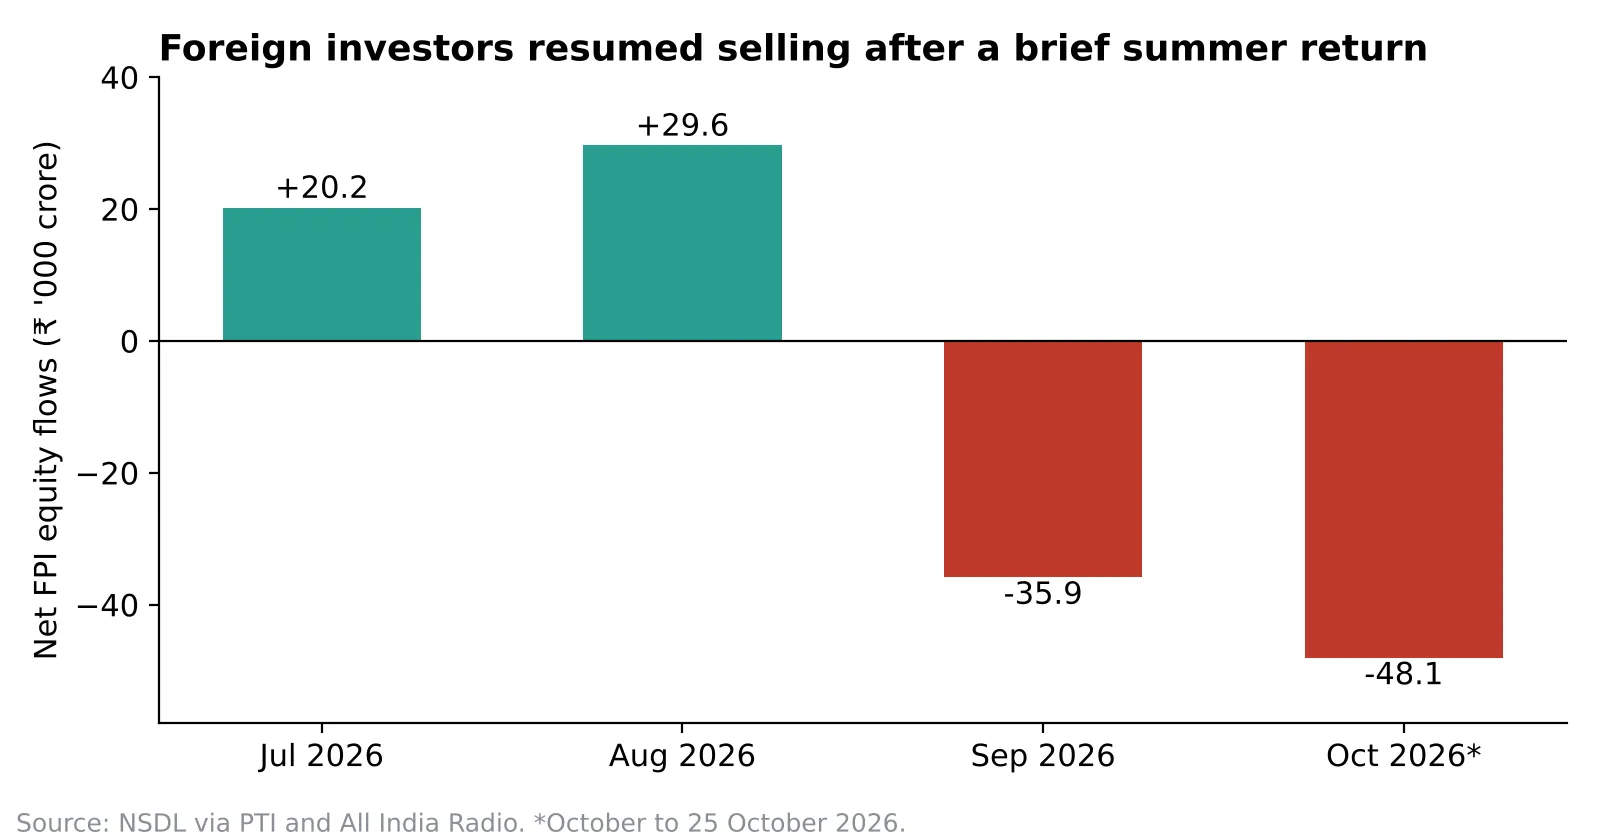
India has few listed companies that sell chips, AI hardware or frontier models. For a global fund building AI exposure, India became a source of cash. US 10-year Treasury yields above 5.2%, a firm dollar and expensive crude oil added to the pressure. Foreign selling of Indian equities in 2026 has reached nearly double the ₹1.66 lakh crore sold in all of 2025.
The AI trade faces the same productivity test
The capital flowing into AI is also long-gestation capital. Anthropic's prospectus lists about US$518 billion in planned compute spending, and OpenAI has pointed to about US$1.4 trillion over eight years. The IMF has modelled a correction in which an unwinding of AI investment lowers global GDP by up to 0.4% by 2028, and it has flagged the rise of debt-funded spending by large technology firms. Global markets are asking of AI the same question Indian companies are asking of their own plants: will the output justify the capital? A weaker answer would change where global money flows next, and India would be among the markets to benefit.
What does this mean for Indian stock markets?
Share prices follow the return companies earn on their capital. When new investment arrives ahead of demand, assets grow faster than earnings and return ratios slip. Investors have responded by favouring companies whose capital already earns well and by staying cautious on capital-heavy sectors with long payback periods.
Domestic savings have steadied the market. Mutual funds and other domestic institutions absorbed much of the foreign selling, and the Nifty recovered to about 23,100 in late October. The Nifty IT index gained nearly 12% in a single week as investors priced in revenue from AI implementation work. Listed companies raised capex by 11% in 2025-26, according to Citi, which shows that firms with strong balance sheets are investing selectively.
Return ratios will decide whether foreign money returns
Profits relative to capital employed for Indian companies reached a 14-year high in late 2025. The test now is whether that holds as new capacity comes on stream. If projects started in 2026-27 lift output quickly, return ratios stay firm and India becomes a strong candidate for returning foreign money. If projects run late, the market will keep discounting the investment numbers.
Can India's new strategic bets avoid the same delays?
India's newest investment priorities share the long-gestation profile. The India Semiconductor Mission committed about US$9 billion, and Semicon 2.0 added US$13 billion in July 2026, starting with 28-nanometre production. McKinsey estimates that fabs in Taiwan and mainland China begin production 12 to 16 months after construction starts, against about 24 months in Europe and the US. Reliance and the Adani Group have together committed more than US$200 billion to AI data centres and the power to run them. Data centres need large amounts of capital and employ relatively few people for each rupee invested.
These projects can lift productivity once they run at full use. A European survey of chip industry experts published in July 2026 ranked shortages of private capital, skilled workers, customers and affordable power as the main threats to a chip ecosystem. The same conditions apply in India. A fab or data centre that waits for grid power, permits or customers will repeat the pattern already visible in renewable energy and expressways.
See what markets are pricing in
Live indices, sector moves and market breadth — the backdrop to every story we publish.
What would make private investment pick up faster?
Policy has focused on raising the amount of investment. The evidence points to raising what existing capital earns.
Raise utilisation before adding capacity. Stronger export and consumer demand will do more to trigger private capex than added incentives for new plants.
Shorten commissioning. Grid connections, land and environmental approvals decide when an asset starts producing. Each month saved raises its return.
Lower the cost of capital. Deeper bond markets and stable inflation would reduce the hurdle rate for long projects.
Back productivity-raising investment. Software, automation, research and skills lift output from assets already in place.
The signals worth tracking
Five indicators will show whether the shift is under way: capacity utilisation in the RBI's quarterly survey, the private share of GFCF in the next national accounts release, completion rates of sanctioned projects, return on capital in quarterly results and monthly foreign portfolio flows.
India is investing at a faster pace in 2026, which is a necessary start. Companies, foreign investors and the stock market are all applying one test to that investment: what it earns. Private capital will commit at scale once existing plants run fuller and new assets start producing on time. The same improvement in capital productivity would give global investors a reason to bring their money back to India.


