


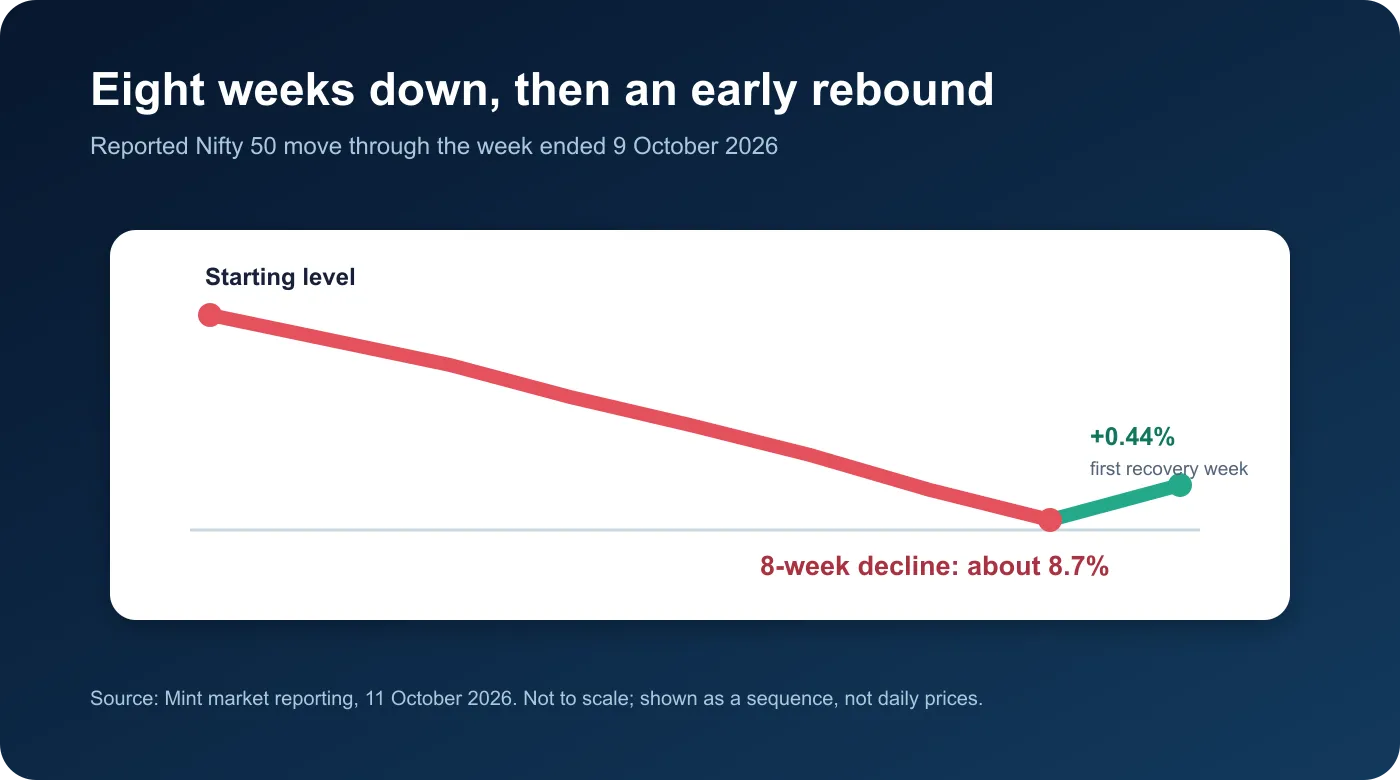
The Nifty 50 ended an eight-week losing streak in October 2026 after losing about 8.7% over the preceding eight weeks, then gaining roughly 0.4% in the week ended 9 October. Foreign selling, crude oil above $100 a barrel, a weaker rupee and uneven earnings shaped the move.
For investors asking why is Nifty falling, the answer is not one headline. An index moves when expectations for earnings, rates and risk premiums change together. Test the recovery against flows, oil, currency, earnings and breadth.
Nifty 50 Market Update: From an Eight-Week Losing Streak to a Volatile Recovery
The Nifty 50 fell for eight consecutive weeks through early October, its longest such run in about 25 years. It then closed at 22,520.45 on 9 October after a 1.30% Friday gain. The weekly advance was about 0.44%, breaking the sequence but remaining modest versus the prior decline.
The next week was stronger, helped by IT and selective large-cap buying. Yet participation remained uneven. A durable recovery normally has improving breadth, stronger earnings confidence and less macro pressure.
This is why the question why is Nifty down should be separated from “has the market bottomed?” The first asks what changed; the second requires evidence that those changes are reversing.
See what markets are pricing in
Live indices, sector moves and market breadth — the backdrop to every story we publish.
Why Is Nifty Falling? Key Factors Behind the Recent Decline
Foreign Institutional Investor (FII) Selling and Bearish Market Positioning
Foreign portfolio investors trade heavily in liquid index constituents. During the final week of the losing streak, reported FII equity selling reached about ₹44,013 crore. Domestic institutional buying can absorb part of that supply, but sustained foreign outflows can still weaken prices, the rupee and risk appetite.
When readers ask why is Nifty falling , the flow answer should be interpreted with positioning. Cash-market selling, index-futures shorts and global fund redemptions can reinforce one another, but a sudden reduction in bearish positions can also produce a sharp relief rally.
Rising Crude Oil Prices and Their Impact on the Indian Economy
India imports most of the crude oil it consumes. Higher oil can increase the import bill, pressure the current account, weaken the rupee and raise costs for petroleum users. Brent above $100 during the October rebound kept this risk prominent.
Oil does not affect every company equally. Producers may benefit while airlines, logistics businesses and manufacturers can face margin pressure. This sector-level difference is one reason why is Nifty 50 falling can have a different answer from why a particular stock is rising.
US Bond Yields, Global Interest Rates and Investor Sentiment
High US Treasury yields increase the return available on dollar assets. That can make riskier emerging-market equities less attractive unless their expected returns also rise. In late October, the US 10-year real yield was around 2.6% to 2.7%, according to US Treasury data, while nominal yields remained elevated in market reporting.
Higher discount rates reduce the present value of distant cash flows, making expensive equities more sensitive. This global repricing is central to why indian stock market is falling even when India’s long-term growth case has not disappeared.
Rupee Volatility and RBI Monetary Policy
A weaker rupee can raise imported inflation and the local cost of oil, while helping some exporters translate dollar revenue. Monetary policy then becomes a balancing act between inflation, currency stability and domestic growth. The October policy backdrop was perceived as tight, adding to concerns about funding costs and demand.
The same rupee decline can have different implications depending on reserves, inflation expectations and capital flows.
Banking Stocks, Corporate Earnings and Valuation Concerns
Banks carry a large weight in the Nifty 50, so their loan growth, deposit costs, asset quality and net interest margins matter to the index. When rates stay high, funding can become expensive even if credit demand remains healthy. Consumer lenders also face questions about unsecured credit and delinquencies.
Valuations must also be supported by earnings. If profit estimates are cut while prices remain high, multiples expand mechanically. That explains part of why is Nifty falling: investors demand a wider margin of safety until visibility improves.
Sectoral Divergence: Why IT Stocks Recovered While Other Sectors Faced Pressure
IT stocks led parts of the rebound after quarterly results and commentary improved confidence in overseas demand and artificial-intelligence-related work. A weaker rupee can also support reported revenue for exporters. Domestic cyclicals, real estate and rate-sensitive sectors did not receive the same support.
The result was rotation rather than uniform strength. An indian stock market down headline can coexist with gains in exporters or defensive shares because index performance is an aggregation of differently weighted companies.
Is Nifty's Recent Recovery a Trend Reversal or a Relief Rally?
The first rebound week looked more like stabilisation than a confirmed reversal. Lower weekly closes ended, but the gain was small and underlying pressures persisted. A stronger second week improved momentum, yet breadth and earnings still needed confirmation.
A trend reversal usually shows higher highs and lows, rising participation, better earnings revisions and lower volatility. A relief rally can be narrow and driven by oversold conditions. Neither label is certain.
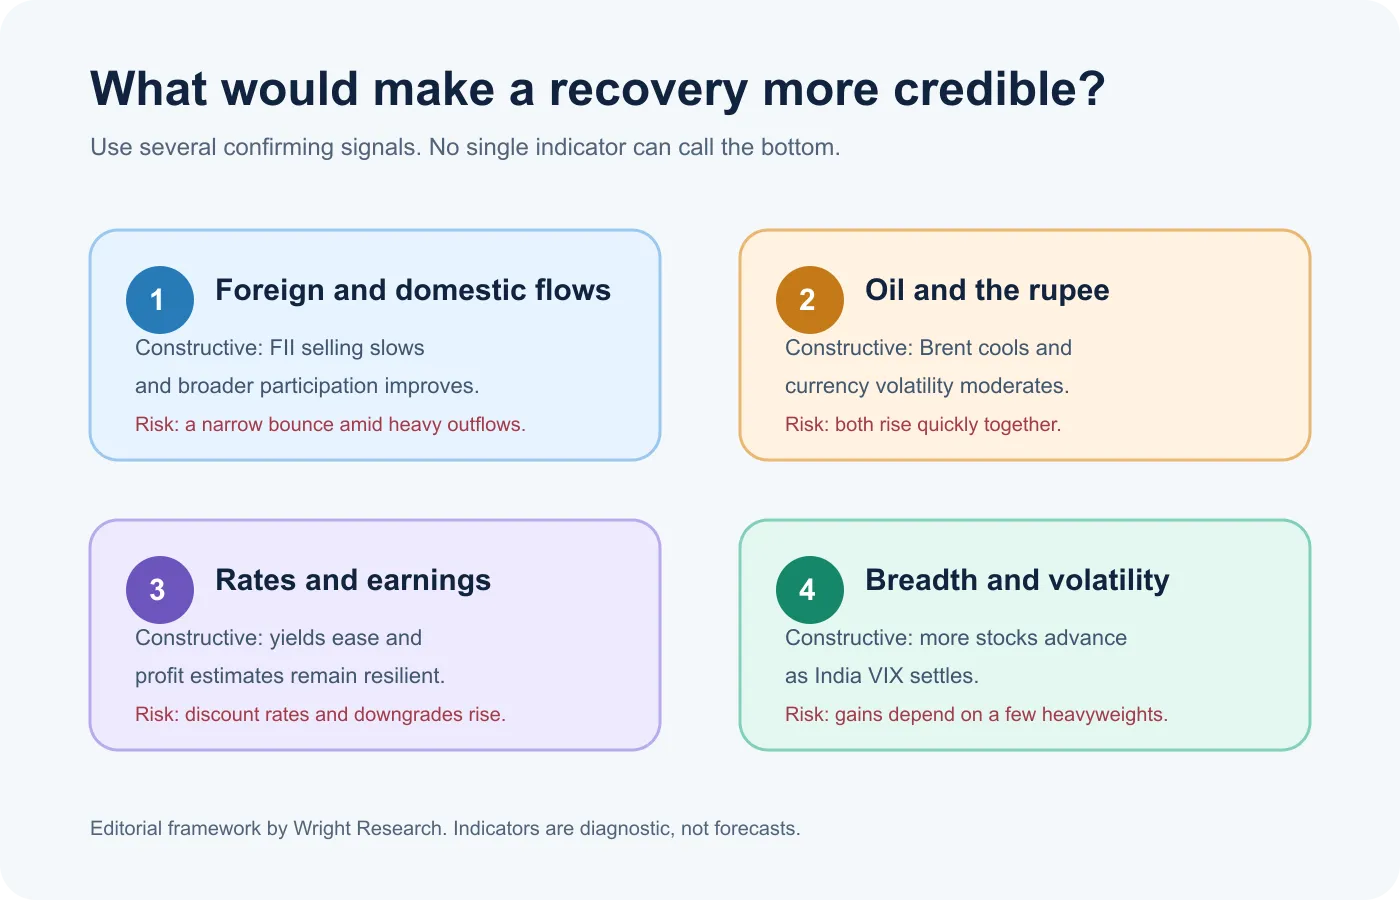
The practical response to why is Nifty down is a dashboard, not a prediction. If oil and yields fall, the rupee stabilises, foreign selling moderates and earnings estimates hold, the recovery gains credibility.
Get research like this in your inbox
The week’s research that mattered, in five minutes. Joined by 2L+ investors.
Which Market Indicators Should Investors Watch Next?
FII and DII Cash-Market Flows
Track rolling five-day and monthly flows rather than one session. Persistent FII selling accompanied by DII buying suggests domestic savings are cushioning, not necessarily reversing, foreign pressure. A turn in both price and foreign flows would be more constructive.
Brent Crude Prices and the Rupee-Dollar Exchange Rate
Oil and the rupee can amplify one another because crude is paid for in dollars. Watch the direction, speed and duration of moves. A gradual change is easier for companies to absorb than a sudden shock.
US Treasury Yields and RBI Policy Signals
Falling global yields can reduce the relative appeal of dollar bonds and ease equity discount rates. RBI communication matters for domestic liquidity, credit conditions and inflation expectations. Read policy statements, not only the repo-rate headline.
India VIX, Market Breadth and Key Technical Levels
India VIX reflects expected near-term volatility, not market direction. Combine it with advance-decline data, the share of stocks above key moving averages and whether recoveries hold above prior resistance. Wright Research’s market dashboards can help investors monitor these signals together.
| Indicator | Why it matters | Constructive evidence | Warning sign |
|---|---|---|---|
| FII and DII flows | Shows who is supplying or absorbing shares | FII selling slows while breadth improves | Heavy outflows continue despite index bounces |
| Brent and USD/INR | Affects inflation, margins and the import bill | Oil cools and rupee volatility falls | Both rise quickly together |
| Earnings revisions | Anchors valuation | More upgrades than downgrades | Broad cuts to profit forecasts |
| India VIX and breadth | Tests the quality of a rally | VIX eases as more stocks participate | Index rises on a few heavyweights |
What Should Long-Term Investors Do During a Market Correction?
Start with goals, horizon and asset allocation. Near-term money should not depend on an equity rebound. For long-horizon capital, rebalance in stages. Review business quality, balance-sheet strength and valuation before averaging down.
The reasons for Nifty fall do not automatically invalidate a diversified plan. Corrections are normal, but individual companies can suffer permanent impairment. Separate market-wide repricing from a broken investment thesis.
Investors who need professional oversight can assess whether a rules-based portfolio management service suits their capital, risk tolerance and liquidity needs. Asking why indian stock market is falling or why is Nifty falling should lead to risk review, not impulsive exits.
Conclusion: What the Nifty Decline and Recovery Mean for Investors
So, why is Nifty falling? The recent decline combined foreign selling, expensive oil, elevated global yields, rupee pressure, tight policy conditions and uncertainty about earnings. The rebound ended an unusual eight-week losing streak, but the early evidence did not by itself prove a new uptrend.
Monitor the drivers, keep position sizes appropriate and connect decisions to goals. Asking why is Nifty 50 falling is useful when it prompts a disciplined review of flows, macro conditions, earnings and valuations.
Is your portfolio built for what’s coming?
Get a free AI-powered review of your holdings — risk, overlap and quality in minutes.
FAQ
Which sectors contributed most to the Nifty decline?
Financials and other large index constituents can have an outsized effect because of their weights. In the recent episode, pressure was broad but sector performance diverged, with IT participating more strongly in the rebound than several domestic cyclical sectors.
What is the difference between a market correction and a bear market?
A correction commonly refers to a decline of at least 10% from a recent peak, while a bear market commonly refers to a fall of at least 20%. These are market conventions, not guarantees about duration or recovery.
Can domestic institutional investor buying offset FII selling during a market decline?
It can cushion the impact and support selected stocks, but the result depends on the size, persistence and concentration of both flows. DII buying does not ensure the index will rise if foreign selling or earnings downgrades remain strong.
Does a falling Nifty 50 mean every stock in the index is declining?
No. The Nifty 50 is weighted by free-float market capitalisation. A few large constituents can move the index even while many stocks behave differently, and sector rotation can produce winners during an overall decline.
What is the difference between Nifty 50 price returns and total returns?
The price index measures changes in constituent share prices. A total return index also assumes dividends are reinvested, making it more appropriate for comparing long-term investment performance.
For education only, not investment advice. Market data can change rapidly. Consult a SEBI-registered adviser where appropriate.


