


Markets rarely move in a straight line. An advancing stock can pause or pull back before resuming its trend, while a falling stock can stage a temporary rebound. Fibonacci retracement levels give traders a consistent way to mark where those counter-trend moves may encounter support or resistance.
The levels are reference zones, not predictions. This guide explains the calculation, chart-drawing process and a practical risk-managed setup—and shows why price action and confirmation matter more than a line alone.
What Is Fibonacci Retracement in Trading?
Fibonacci retracement in trading is a technical-analysis method that divides the distance between a meaningful swing low and swing high into percentage levels. Traders project those levels onto a chart to identify areas where a pullback may pause, reverse or consolidate.
The method comes from ratios associated with the Fibonacci number sequence. As the sequence progresses, divisions approach 0.618, 0.382 and 0.236. Charting platforms convert them into 61.8%, 38.2% and 23.6% retracements.
Unlike a moving average, a fibonacci retracement tool does not update from a rolling price formula. The trader chooses two anchors. That judgment makes swing selection—and the broader trend—central to the result. Readers new to chart structure may first review technical analysis in the stock market.
See what markets are pricing in
Live indices, sector moves and market breadth — the backdrop to every story we publish.
Key Fibonacci Retracement Levels and What They Mean
The commonly displayed fibonacci retracement levels are 23.6%, 38.2%, 50%, 61.8% and 78.6%. They represent how much of the original move has been retraced, not the probability of a reversal.
| Level | Typical interpretation | What to verify |
|---|---|---|
| 23.6% | Shallow pullback in a strong trend | Momentum remains firm; price may barely pause |
| 38.2% | Moderate retracement | Prior structure or a moving average may add confluence |
| 50% | Half of the measured move | Widely watched, although not a Fibonacci ratio |
| 61.8% | Deep retracement at the “golden ratio” | Look for stronger price confirmation |
| 78.6% | Very deep pullback | Trend thesis is vulnerable if the swing origin breaks |
The 50% marker is included because markets often retrace roughly half a move and traders watch it—not because 0.5 is derived from the Fibonacci sequence. The 78.6% level is commonly calculated as the square root of 61.8%.
Treat fibonacci retracement levels as zones rather than exact prices. Orders, volatility and liquidity do not respect a single decimal. A prior breakout, gap, high-volume area or trend line near the same level can make the area more useful, but no combination guarantees a bounce.
Fibonacci Retracement Formula: How to Calculate the Levels
First calculate the measured range:
Range = Swing high − Swing low
For an uptrend, potential support is measured down from the high:
Retracement price = Swing high − (Range × retracement ratio)
For a downtrend, potential resistance is measured up from the low:
Retracement price = Swing low + (Range × retracement ratio)
This fibonacci retracement formula is the same calculation performed by charting software. Suppose a stock advances from ₹200 to ₹300. The range is ₹100. A 38.2% pullback is ₹300 − (₹100 × 0.382) = ₹261.80.
| Retracement | Calculation from ₹300 high | Indicative price |
|---|---|---|
| 23.6% | ₹300 − ₹23.60 | ₹276.40 |
| 38.2% | ₹300 − ₹38.20 | ₹261.80 |
| 50.0% | ₹300 − ₹50.00 | ₹250.00 |
| 61.8% | ₹300 − ₹61.80 | ₹238.20 |
| 78.6% | ₹300 − ₹78.60 | ₹221.40 |
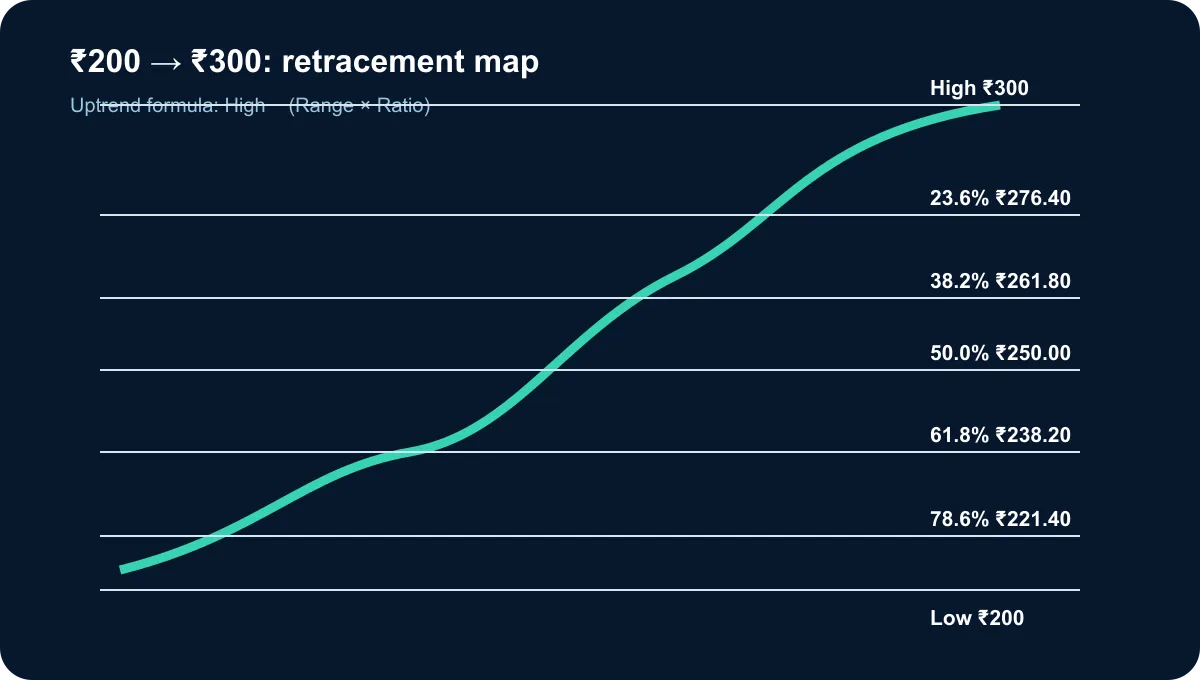
This fibonacci retracement example is intentionally simple. Real charts have gaps, wicks and several plausible swings, so calculation accuracy does not remove selection risk.
How to Draw Fibonacci Retracement on a Stock Chart
Choose a clear directional move before opening the fibonacci retracement tool. The anchors should define the impulse leg being analysed, not two arbitrary nearby candles. Use a timeframe consistent with the trade: a weekly swing is usually too broad for a five-minute setup, while a five-minute swing is noisy for a positional trade.
Drawing Fibonacci Retracement in an Uptrend
Identify a meaningful swing low from which price advanced and the subsequent swing high at which the pullback began. Drag the tool from low to high. The platform will display fibonacci retracement levels below the high as possible support zones.
Prefer established pivots visible to other market participants. A wick that clearly marks rejection can make a useful anchor, but consistency matters. For an exceptional spike, compare wick-based and body-based drawings.
Drawing Fibonacci Retracement in a Downtrend
Identify the swing high that began the decline and the following swing low. Drag from high to low. The levels now appear above the low and may act as resistance during a rebound.
If price makes a fresh low, the measured impulse has extended and the tool should normally be redrawn. In either direction, understanding price action and market structure helps distinguish an active swing from random noise.
Get research like this in your inbox
The week’s research that mattered, in five minutes. Joined by 2L+ investors.
How to Use Fibonacci Retracement in Trading
Learning how to use fibonacci retracement means building a decision process, not buying automatically at 61.8%. Start with trend, mark the impulse, identify overlapping evidence, wait for a trigger and define invalidation before entry.
Identifying Potential Support and Resistance Zones
Look for a Fibonacci line close to a prior swing, breakout-retest area, trend line, moving average or high-volume zone. This overlap is called confluence. If several unrelated methods point to a similar area, traders may pay closer attention there.
In an uptrend, a retracement zone can frame potential support. In a downtrend, it can frame potential resistance. A decisive close through a zone is information—not an invitation to keep averaging because the percentage “should” work.
Confirming Fibonacci Levels With Candlestick Patterns and Other Indicators
Confirmation can include a bullish rejection candle at support, a bearish reversal candle at resistance, a break of a minor counter-trend line, improving volume or momentum divergence. The confirmation should occur near the zone and fit the primary trend.
Candles should be read in context. A hammer after a controlled pullback is different from the same shape during a disorderly sell-off. Wright Research’s guide to reading candlestick charts explains this distinction.
Planning Entries, Stop-Losses and Profit Targets
A trade plan can place entry after confirmation, a stop beyond the structure that invalidates the setup, and targets at the prior swing or selected extension areas. Do not place every stop exactly on a widely watched line; allow for normal volatility while keeping risk affordable.
Position size should follow the distance between entry and stop. If that distance widens, quantity should generally fall. Systematic traders can test objective anchor and confirmation rules through algorithmic trading research , but backtests still require realistic costs and out-of-sample checks.
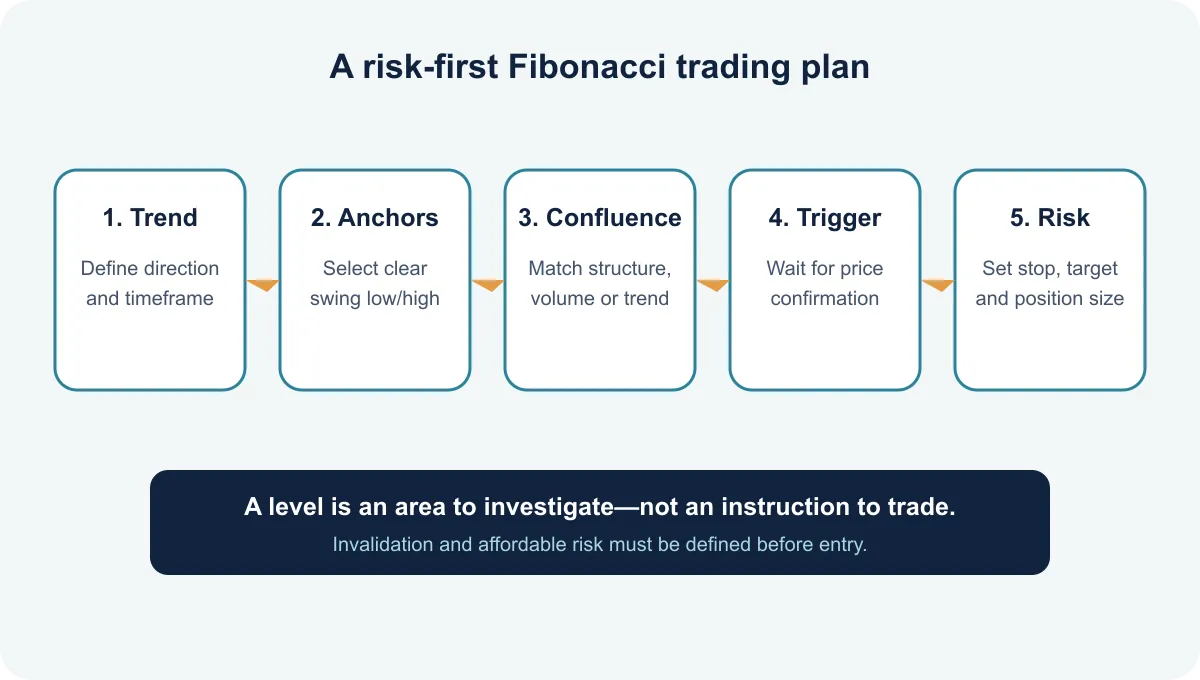
Fibonacci Retracement Strategy With a Practical Example
Consider the ₹200-to-₹300 advance used above. Price then retreats toward ₹261.80, the 38.2% area, which also sits near an earlier breakout at ₹260. Instead of placing an unconditional buy order, the trader waits for price to reject the area and close above the high of a bullish reversal candle.
Assume confirmation produces an entry at ₹266. A structural stop might sit below the breakout zone at ₹256, so risk is ₹10 per share. The previous high at ₹300 is an initial reference target, creating potential reward of ₹34 per share before costs. If the trader permits ₹5,000 risk, a simple maximum size is 500 shares (₹5,000 ÷ ₹10), subject to capital, liquidity and slippage constraints.
This fibonacci retracement strategy works as a framework because trend, horizontal support and price confirmation agree. It can still lose. A gap below the stop, weak liquidity or a market-wide shock may create a worse exit than planned.
If the 38.2% area fails without confirmation, the trader can remain flat and observe 50% or 61.8%. That is a second fibonacci retracement example of the tool’s proper role: organising scenarios, not compelling a trade. Screening a broader universe of stocks may also be preferable to forcing a setup in one counter.
Advantages and Limitations of Fibonacci Retracement
| Advantages | Limitations |
|---|---|
| Creates repeatable reference zones across markets and timeframes | Anchor selection is subjective |
| Helps organise entries, invalidation and targets | Levels can fail or be briefly overshot |
| Works with price structure and other indicators | Too many swings can produce conflicting grids |
| Simple fibonacci retracement formula is transparent | Historical ratios do not predict news or gaps |
The main advantage of fibonacci retracement in trading is discipline: the chart becomes a set of conditional scenarios. The main limitation is false precision. Different traders can choose different pivots, and a zone may appear successful simply because many percentages and prior prices cover the chart.
A robust fibonacci retracement strategy therefore requires independently defined trend, trigger, stop and position-sizing rules. Results should be evaluated over many trades, including brokerage, taxes and slippage—not by highlighting one attractive chart.
Common Mistakes to Avoid When Using Fibonacci Retracement
- Drawing from minor pivots while ignoring the higher-timeframe trend.
- Treating every level as an automatic entry instead of waiting for evidence.
- Moving anchors after entry merely to justify a losing position.
- Using several overlapping grids until one line fits current price.
- Placing a stop without considering volatility, gaps and position size.
- Assuming the 61.8% ratio has predictive power on its own.
When learning how to use fibonacci retracement, write the anchor, entry trigger and invalidation rule before placing the order. That record makes the process testable and reduces hindsight bias. The best-looking fibonacci retracement levels are irrelevant if the trade’s downside is undefined.
Is your portfolio built for what’s coming?
Get a free AI-powered review of your holdings — risk, overlap and quality in minutes.
Frequently Asked Questions About Fibonacci Retracement
Is the 50% level a true Fibonacci ratio?
No. The 50% retracement is not derived from the Fibonacci sequence. Charting tools include it because half-way retracements are widely observed and monitored by traders.
What is the difference between Fibonacci retracement and Fibonacci extension?
Retracement measures a counter-trend move within the original high-low range. Extension projects beyond that range and is often used to frame possible targets after price resumes the trend. Both remain reference levels rather than forecasts.
Should Fibonacci retracement be drawn from candle wicks or closing prices?
Wicks are commonly used when they define clear swing extremes. Closing prices or candle bodies can be more representative when an isolated wick reflects abnormal volatility. Choose a consistent rule, compare alternatives when needed and test it across many setups.
How often should traders redraw Fibonacci retracement levels?
Redraw when the impulse leg materially changes—for example, when an uptrend makes a new swing high or a downtrend makes a new swing low. Avoid redrawing simply because a live trade is not behaving as expected.
Used carefully, fibonacci retracement levels can turn an uncertain pullback into a defined set of scenarios. Their value comes from disciplined context, confirmation and risk control—not from the ratios alone.


