


Derivatives data can show not only what traded today but also how many contracts remain outstanding. That second measure is open interest, commonly shortened to OI. It helps traders assess participation, position creation and the distribution of activity across futures expiries or option strikes.
The open interest meaning is frequently misunderstood. It is not the number of bullish traders, and a rising figure is not automatically positive for price. Every outstanding contract has a long and a short side. Directional interpretation requires price, volume, volatility, expiry and market context.
What Is Open Interest?
Open interest is the total number of futures or options contracts that have not been offset, exercised, expired or otherwise settled. The exchange counts each contract once, even though it connects a buyer and a seller.
For example, if A opens one long contract and B opens one short contract, OI increases by one. If both later offset those positions, it decreases by one. A transfer from a closing holder to a new participant can generate trading activity without changing the outstanding total.
Another way to express the open interest meaning is as a stock of active contracts at a point in time. Volume is a flow of transactions during a period. NSE publishes both because they answer different questions.
See what markets are pricing in
Live indices, sector moves and market breadth — the backdrop to every story we publish.
How Does Open Interest Work?
How does open interest work when two orders match? The answer depends on whether each side is opening or closing. Both opening creates a new contract. Both closing extinguishes one. One opening and one closing merely transfers an existing obligation.
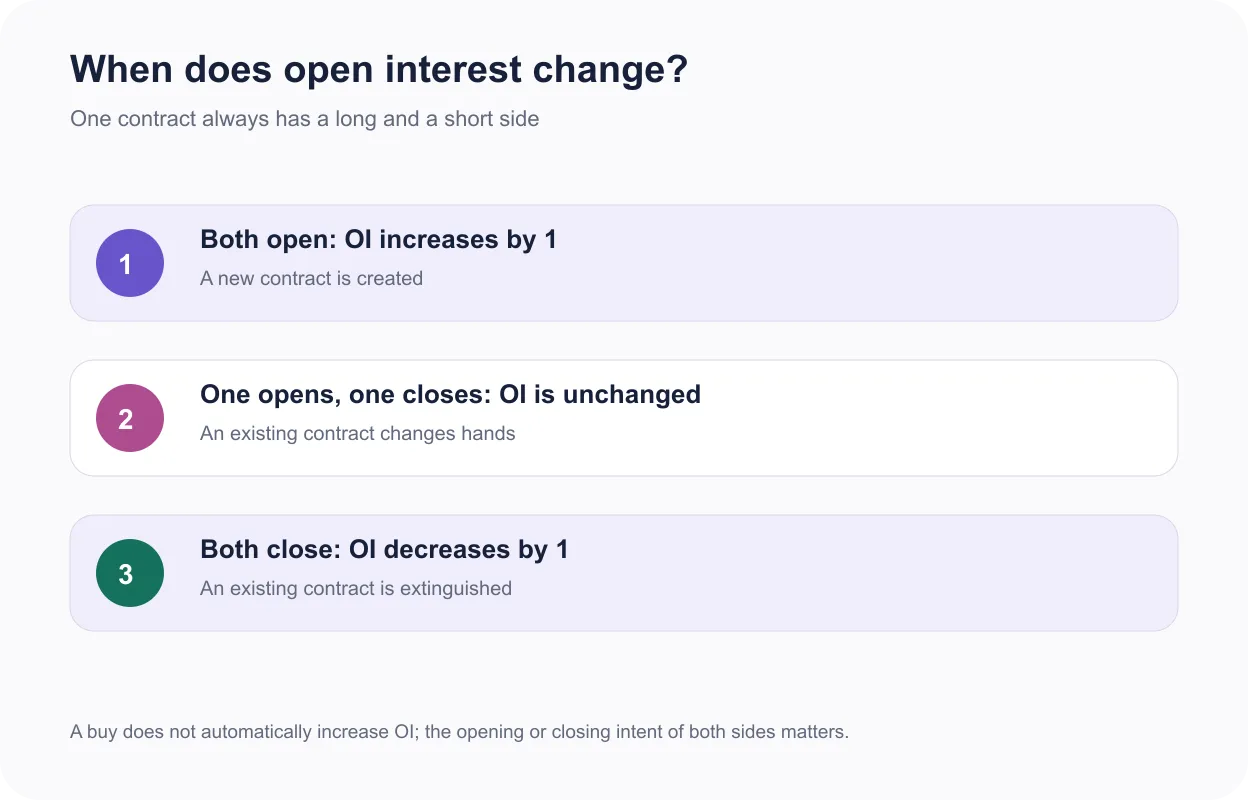
| Buyer | Seller | OI effect |
|---|---|---|
| Opens long | Opens short | Increases by one contract |
| Opens long | Closes long | No change |
| Closes short | Opens short | No change |
| Closes short | Closes long | Decreases by one contract |
To understand how does open interest work over time, remember that the figure carries forward from one session to the next. It tends to fall as an expiry approaches and positions are closed or rolled into a later contract.
Open Interest in Futures vs Options
Open interest in futures is normally read by underlying and contract month. A rising near-month figure can indicate new exposure, while falling near-month and rising next-month figures may simply show a rollover. Futures OI does not reveal whether the net market is bullish because every long is matched by a short.
Open interest in options adds strike and option type. Traders inspect call and put OI at different strikes and expiries. Large concentrations can reveal where activity is clustered, but the same strike may contain hedges, spreads, market-maker inventory and speculative positions.
The key difference is dimensionality. Open interest in futures is distributed mainly by underlying and expiry; open interest in options is also distributed by call or put and strike. Comparing raw totals without contract multipliers or delta can be misleading.
Open Interest vs Trading Volume
Open interest vs volume is the distinction between outstanding positions and transactions. Ten contracts can change hands many times and create high volume while only ten contracts remain outstanding. Conversely, OI can remain high on a quiet day with little volume.
| Measure | What it counts | Reset behaviour | Primary use |
|---|---|---|---|
| Open interest | Outstanding contracts | Carries forward until closure or expiry | Participation and position build-up |
| Volume | Contracts traded in a period | Daily figures restart each session | Current trading activity |
A second open interest vs volume example is a rollover session. The expiring future may show heavy volume and declining OI, while the next month shows rising OI. Looking only at volume would miss the migration of positions.
Get research like this in your inbox
The week’s research that mattered, in five minutes. Joined by 2L+ investors.
How to Read and Interpret Open Interest Data
Begin with the unit and scope. Check whether the screen reports contracts, underlying quantity, rupee notional or change in OI. Confirm the expiry and timestamp. Combining weekly and monthly options or near and far futures can hide the actual positioning.
Then compare current OI with its recent range and with volume. A large percentage change from a tiny base may be less meaningful than a moderate change in a liquid contract. Also inspect the bid-ask spread and whether activity is concentrated in one strike.
For options, map calls and puts across strikes rather than relying on one “maximum OI” number. Use Wright Research’s guide to open interest in options alongside option premium, implied volatility, moneyness and expiry mechanics.
The practical open interest meaning comes from change, distribution and context, not the largest absolute cell in an option chain.
Put-call ratios need context
A put-call OI ratio divides put contracts by call contracts for a selected universe. The result changes with expiry, strike range and whether the calculation uses contracts or value. A high ratio can reflect protective hedging as easily as aggressive bullish positioning, while a low ratio can reflect covered calls or market-making activity. Compare the same methodology through time, identify the strikes driving the change and avoid treating a single threshold as universal.
Rising vs Falling Open Interest: What It Signals
Rising OI shows that new contracts have been added. Falling OI shows that outstanding contracts have been closed. Pairing that change with price creates a common four-quadrant framework, but the labels are hypotheses rather than facts about every participant.
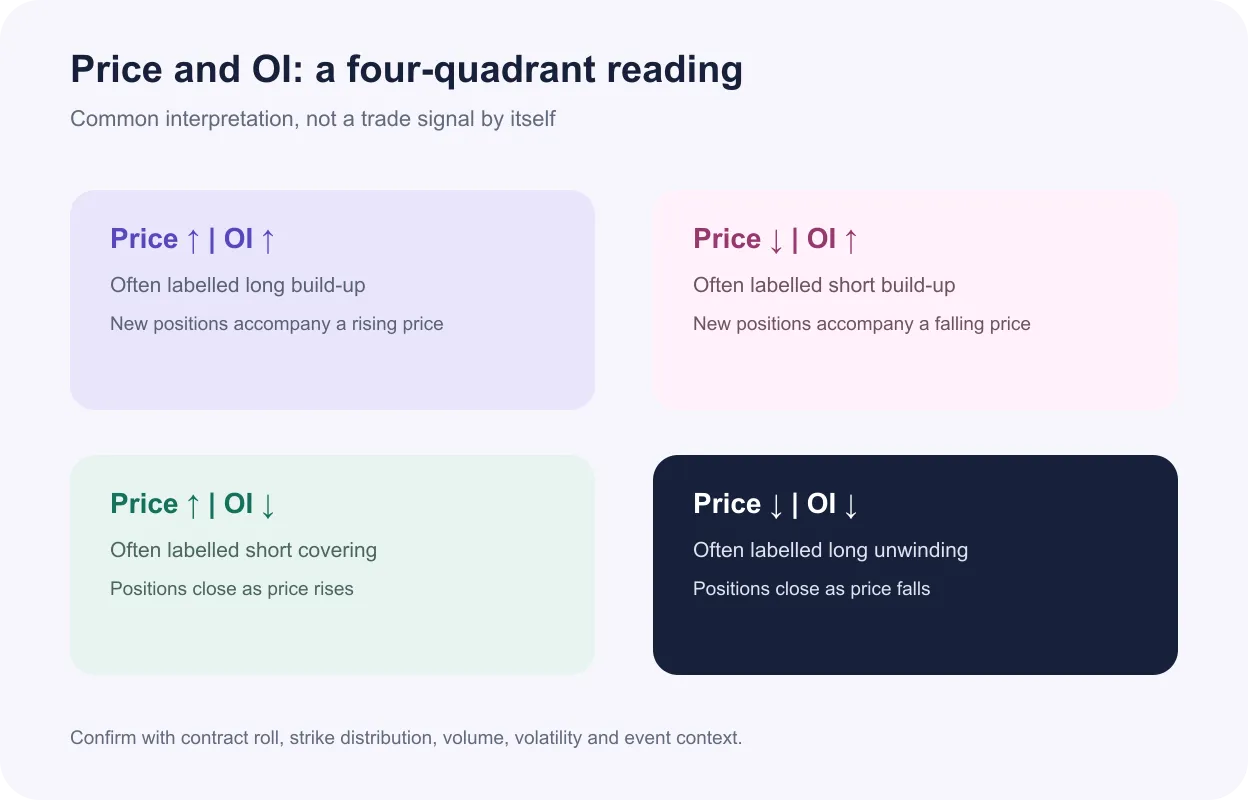
Price up with OI up is often called long build-up; price down with OI up is often called short build-up. Price up with OI down may be described as short covering, while price down with OI down may be called long unwinding.
These labels can fail around rolls, expiry, corporate events and multi-leg trades. A participant may be hedging another position. Market makers can carry inventory that has no simple directional meaning. Confirm the signal across relevant expiries and related instruments.
Using Open Interest Analysis in Trading Decisions
Open interest analysis can help screen contracts with deeper participation, compare how positions migrate and identify strikes that deserve attention. It is most useful as one layer in a broader process rather than an automatic entry signal.
A trader might compare price trend, change in OI, volume, implied volatility and scheduled events. In futures, the basis and rollover spread add context. In options, delta, time to expiry and volatility skew matter. The chosen contract should also have an acceptable bid-ask spread.
Record the observation before acting, including the exact contract, timestamp and competing explanation. This makes later review possible and reduces hindsight-based interpretation.
Use open interest analysis within a written trading plan that defines risk, position size and invalidation. Wright Research’s stock-market strategy guide provides the broader framework. Never infer that a crowded strike must hold: positions can be closed quickly and price can gap through it.
Limitations of Open Interest as an Indicator
OI does not disclose participant identity, motivation or average entry price. It cannot distinguish a naked directional bet from one leg of a hedge or spread. Public data may also be end-of-day or delayed depending on the source.
High OI is not identical to easy execution. Liquidity depends on active quotes, spread and depth. A contract can have large outstanding positions but poor immediate trading conditions, especially away from the most active expiry.
Data timing and contract adjustments
Exchange and broker screens may show live, delayed or end-of-day values. Corporate actions, lot-size revisions and contract migrations can disrupt simple comparisons with earlier data. Confirm whether change is measured from the previous close or from the session open. The open interest meaning also changes when a platform aggregates several expiries, because growth in a later month can conceal closure in the expiring month. Clean contract-level data should precede interpretation.
Open interest in options can be distorted by contract size, deep in-the-money positions and delta differences. Comparing contract counts alone can exaggerate the economic exposure of low-delta options.
Finally, how does open interest work during expiry? Positions disappear, exercise or roll, causing mechanical changes that can overwhelm normal interpretation. Traders should use contract-specific data and treat OI as descriptive evidence, not a forecast.
Is your portfolio built for what’s coming?
Get a free AI-powered review of your holdings — risk, overlap and quality in minutes.
FAQ
What does open interest mean in trading?
It is the number of derivative contracts that remain outstanding and have not been closed, exercised or expired. Each outstanding contract has one long side and one short side, but it is counted once.
How is open interest different from volume?
Volume counts contracts traded during a period and resets for a new session. OI is an outstanding stock that changes when positions are created or extinguished and carries forward until contracts close or expire.
What does rising open interest indicate?
It shows that the number of outstanding contracts has increased. Direction cannot be inferred from that fact alone; price, contract month, strike, volume and participant context are also required.
How do you use open interest in options trading?
Traders compare OI and its change across calls, puts, strikes and expiries, then combine the distribution with price, volume and implied volatility. Concentrated OI can identify areas to investigate, not guaranteed support or resistance.
Is high open interest good or bad?
Neither by itself. High OI can accompany strong participation and liquidity, but it does not reveal whether longs or shorts are correct and cannot prevent gaps or rapid position changes.
How is open interest calculated?
The exchange counts outstanding contracts once. It rises when both counterparties open, falls when both close, and stays unchanged when an opening trade is matched with a closing trade.


